Let’s say you want to research the secure kernel. You heard about hypervisors and VTL1 and you’d like to see it for yourself, and static analysis is just not always good enough. You need a debugger.
You immediately run into a problem: you can’t debug the secure kernel. Or secure processes. Or anything running in VTL1. Sure, you can debug the hypervisor, and through painful analysis of physical memory and memorizing a lot of offsets and byte patterns you can find the secure kernel and work your way from there. That’s exactly what Francisco Falcon (then from Quarkslab) did a few months ago to debug an Isolated User Mode (IUM) process (also known as secure process). He published his work here. His process was extremely impressive, but hard to reproduce since the hypervisor binaries don’t ship with public symbols and offsets and structures change between builds, so you’d have to find the correct one for every individual build.
If you want to debug the hypervisor itself, you don’t have much of a choice but to deal with the painful process. But for debugging the secure kernel (and through it, IUM processes), you can try LiveCloudKd instead.
Originally developed by Matt Suiche and maintained by Gerhart since 2020, LiveCloudKd allows you to attach a live debugger to a virtual machine and debug the secure kernel. The repository does have instructions for how to set up the debugger, but they didn’t fully work for me, so I’ll document my process here in hopes it helps someone else and show some uses for having a kernel debugger attached to the secure kernel.
Initial Setup
Download the latest release of LiveCloudKd. Or, if you want to have the ability to attach a full debugger (and potentially step through code in VTL1), download the LiveCloudKd debugger.
In my setup, I’m using the LiveCLoudKd debugger, build v1.0.22021109.You can find it here.
Choose a VM Setup
Set up a VM that you’d like to debug. The VM needs to support Virtualization Based Security (otherwise what’s the point of all this?), so it has to have at least Windows 10 installed on it. I used Hyper-V as my VM infrastructure and created a VM running Windows 11.
In the documentation, Gerhart recommends a nested VM setup: one VM (with Server 2019 installed on it) acts as the host, and inside it you create another VM that acts as the guest. You set up everything in the host VM and debug the guest VM. This setup works, but I found it inconvenient to work with nested VMs so I set up everything on my host (64-bit Windows 11 23H2) and debugged a VM.
Set Up the Host Machine
Set up the host machine (whether that’s your real host or the host VM):
-
- Install the latest Windows SDK on your host machine. You can download the latest one here or use the Insider Preview SDK if you prefer.
- Install Visual Studio 2022 runtime libraries on your host machine. You can download them here.
- Unzip LiveCloudKd that you downloaded in step 1 and copy its contents into the WinDbg directory (c:\Program Files (x86)\Windows Kits\10\Debuggers\x64).
If you prefer to use the new and improved WinDbg, copy WinDbgX and all its dependencies into a new folder and copy all the LiveCloudKd binaries into the same folder.- In my attempts to run LiveCloudKd, some only worked with the legacy WinDbg and some only worked with the new WinDbg. I encourage you to try both and see what works.
- In an elevated command line, navigate to the directory where you placed LiveCloudKd and install ExdiKdSample with:
regsvr32.exe ExdiKdSample.dll(If you’re using the LiveCloudKd from the main repo, and not the debugger, then the DLL you’ll need to install is called HvmmEXDi.dll)
- Configure your symbol path (c:\symbols, or whatever other directory you choose, must exist):
setx /m _NT_SYMBOL_PATH SRV*C:\Symbols*http://msdl.microsoft.com/download/symbols
Set Up the Guest Machine
- Do not enable nested virtualization for the guest system. It should be disabled by default, but if you need to disable it you can follow this guide to disable it for Hyper-V machines (you’ll need to do that on your host, not inside the guest machine).
- Enable Virtualization Based Security in your guest machine. You can enable it by going to your security settings -> Device Security -> Core Isolation and enabling Memory Integrity.
Or if you prefer to enable it through the registry or through group policy, you can follow these instructions.- You don’t need to disable secure boot in the guest machine to debug it with LiveCloudKd. If you still want to disable secure boot, you’ll need to set this registry value to zero allow Virtualization Based Security to run without secure boot:
HKLM\SYSTEM\CurrentControlSet\Control\DeviceGuard\RequirePlatformSecurityFeatures
- You don’t need to disable secure boot in the guest machine to debug it with LiveCloudKd. If you still want to disable secure boot, you’ll need to set this registry value to zero allow Virtualization Based Security to run without secure boot:
Now, in an elevated command line, navigate to the directory where you set up LiveCloudKd and run it. Choose the index or the virtual machine you’d like to debug, then choose “Start EXDi plugin” (or “Live Kernel Debugger” if you’re using the debugger build, like me). If you’re lucky, you now have a kernel debugger attached to the secure kernel of your guest machine. If that didn’t work, you might be running into the same issue I did. Even though my symbol path was configured correctly, LiveCloudKd ignored it and failed to find the symbols it needed. So, I had to set them up myself.
Symbols
LiveCloudKd the symbols of two modules from the guest machine:
- Ntoskrnl.exe
- Securekernel.exe
So, if you ran into the same issue as me, log into your guest machine and grab both of those binaries from c:\Windows\System32. Copy them to your host machine. Then, download the symbols for both of them using symchk.exe (you can find it in the same directory as the legacy WinDbg):
symchk.exe /r c:\guest_binaries\ntoskrnl.exe /s SRV*C:\Symbols*http://msdl.microsoft.com/download/symbols /v
symchk.exe /r c:\guest_binaries\securekernel.exe /s SRV*C:\Symbols*http://msdl.microsoft.com/download/symbols /v
The output will show you the paths of the two pdb files you’ve downloaded. Copy both of them to the same folder as LiveCloudKd. You’ll also need to rename ntoskrnl.pdb (or ntkrnlmp.pdb) to nt.pdb, since that’s the file name used by LiveCloudKd. No need to rename securekernel.pdb to anything.
Now, try running LiveCloudKd again. If it works, perfect! If it doesn’t, follow me to the next stage.
Multi-phase Solution
Another issue I ran into is that sometimes LiveCloudKd manages to locate ntoskrnl.exe and securekernel.exe but fails at another step further down in its initialization. I haven’t actually found a solution to that, just a way to bypass it. If you suspect that this is what’s happening in your case, try running LiveCloudKd in verbose mode:
LiveCloudKd /v 2
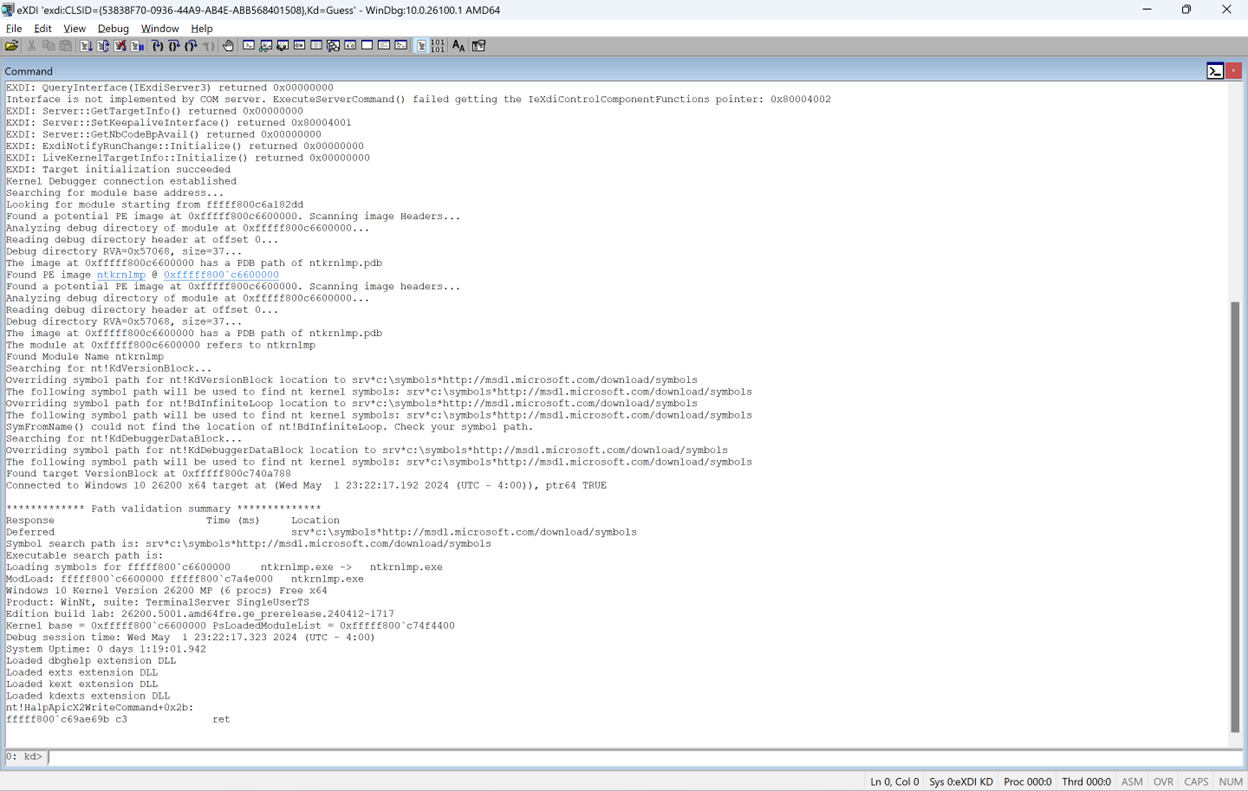
Hopefully, you’ll get an output like this:

Your output might look different, have more errors or fail at a different stage. But if LiveCloudKd successfully printed the base addresses of NT-kernel and securekernel, you’re good to go. The process will not always exit on its own, so you can break out of it now.
In the registry, set this registry value to the index of the VM you chose to debug (the same ID you chose in the LiveCLoudKd interactive input):
HKLM\SOFTWARE\LiveCloudKd\Parameters\VmId
Then, start the live debugger:
windbg.exe -d -v -kx exdi:CLSID={53838F70-0936-44A9-AB4E-ABB568401508},Kd=Guess
Or, if you prefer the active debugger, where you can (potentially) set breakpoints and walk through code, run:
windbg.exe -d -v -kx exdi:CLSID={67030926-1754-4FDA-9788-7F731CBDAE42},Kd=Guess
(If you’re using the new debugger. Replace windbg.exe with WinDbgX. If it doesn’t work, try the legacy debugger instead and vice versa)
And…. Success!
Only the legacy WinDbg worked this time, but a win is a win.
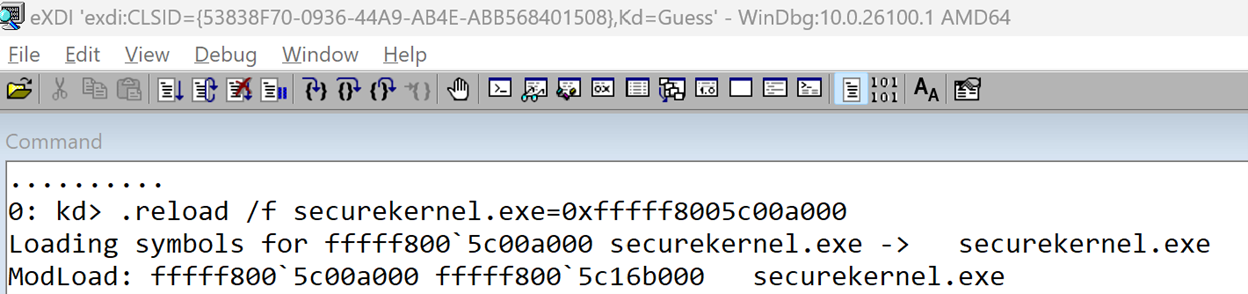
Now, grab the address of securekernel.exe from the previous output, and run in the debugger:
.reload
.reload /f securekernel.exe=<base address>
Now you have the addresses of all the loaded kernel modules as well as the secure kernel, all accessible through the debugger. But the debugger doesn’t know about the other modules loaded in VTL1. Let’s go find them.
VTL1 Loaded Modules
Securekernel.exe is the VTL1 version of the kernel. Just like the regular kernel, the secure kernel is in charge of keeping track of the modules loaded in its address space and loading new ones. It keeps information about the loaded modules in a list that starts at securekernel!SkLoadedModules, which we can read with DX:
dx @$skLoadedModules = (nt!_LIST_ENTRY*)&securekernel!SkLoadedModuleList
@$skLoadedModules = (nt!_LIST_ENTRY*)&securekernel!SkLoadedModuleList : 0xfffff8005c11d750 [Type: _LIST_ENTRY *]
[+0x000] Flink : 0xffffb300022020c0 [Type: _LIST_ENTRY *]
[+0x008] Blink : 0xffffb30002202720 [Type: _LIST_ENTRY *]
Luckily, the entries in this list use the same data structure used by the normal kernel to manage its modules: KLDR_DATA_TABLE_ENTRY. So we can easily parse the list:
dx @$skModules = Debugger.Utility.Collections.FromListEntry(*@$skLoadedModules, "nt!_KLDR_DATA_TABLE_ENTRY", "InLoadOrderLinks")
@$skModules = Debugger.Utility.Collections.FromListEntry(*@$skLoadedModules, "nt!_KLDR_DATA_TABLE_ENTRY", "InLoadOrderLinks")
[0x0] [Type: _KLDR_DATA_TABLE_ENTRY]
[0x1] [Type: _KLDR_DATA_TABLE_ENTRY]
[0x2] [Type: _KLDR_DATA_TABLE_ENTRY]
[0x3] [Type: _KLDR_DATA_TABLE_ENTRY]
And find the names and addresses of all VTL1 kernel modules:
dx -g @$skModules.Select(m => new { Name = m.BaseDllName, Base = m.DllBase, Size = m.SizeOfImage })
==========================================================================
= = (+) Name = Base = Size =
==========================================================================
= [0x0] - "securekernel.exe" - 0xfffff8005c00a000 - 0x161000 =
= [0x1] - "skci.dll" - 0xfffff8005c16e000 - 0x4e000 =
= [0x2] - "symcryptk.dll" - 0xfffff80058762000 - 0xb000 =
= [0x3] - "cng.sys" - 0xfffff8005c1bf000 - 0xd3000 =
==========================================================================
We can, of course, do more complicated things with our new debugger. Like enabling secure kernel debugging, patching variables and functions to allow us to run unsigned code in VTL1 for testing or do lots of other things. But those require more work and effort, so I’ll leave this post an introductory one and leave all those other ideas for future posts.