Troubleshooting a System Crash

One day my system started crashing. A lot. Multiple blue screens per day, with a few different error codes. The worst part – even though my system was configured to collect full memory dumps, no crash dumps were generated (not even mini dumps). They failed to get written every single time, so I couldn’t analyze them to try and get to the root of the problem.

Before giving up and re-imaging my machine, I decided to take a look at Event Viewer to maybe get some hints to what might be going wrong, and maybe find a way to fix it. I started with the Application and System logs found under the “Windows Logs” category. Those didn’t have any information besides generic events letting me know that my system crashed and that a dump file could not be written. And I already knew both of these things.

So, I went to look at other ETW events, with the vague hope of finding something useful. I ended up finding it in an unexpected place – the Microsoft-Windows-Hyper-V-Hypervisor channel:

This really isn’t giving me much information and is in no way an indicator that this is the cause of the crashes, but this is the only unusual thing I could find so it’s a start.

On a side note, I couldn’t find any information about MSR 0x1F1 or why it should be blocked by Hyper-V. If anyone has any information to share with me, I’d be happy to learn! You might also notice that this ETW message discloses some kernel pointers, which is an interesting piece of data. But this is unrelated to the topic of this post so I’ll move on.

Now, let’s look at this driver. This is the “Intel System Usage Report” driver, and there really isn’t much information about what it is or what it’s meant for. This driver creates a device with the same name, so finding the process that uses this driver is easy, using the System Informer search function:

Esrv_svc.exe is a process that runs through the ESRV_SVC_QUEENCREEK service, which is described as “Intel(r) Energy Checker SDK. ESRV Service queencreek”. When looking at the image path that gets executed when the service starts, we can see an unusual path:

"C:\Program Files\Intel\SUR\QUEENCREEK\x64\esrv_svc.exe" "--AUTO_START" "--start" "--start_options_registry_key" "HKEY_LOCAL_MACHINE\SYSTEM\CurrentControlSet\services\ESRV_SVC_QUEENCREEK\_start"

Of course, the next step is to look at the service registry key that is referenced in this command:

The _start registry value is a long command that doesn’t fit in the regedit view, no matter how much I expand it. So I’ll dump it from the command line with reg query:

reg query HKLM\SYSTEM\CurrentControlSet\Services\ESRV_SVC_QUEENCREEK

Type                REG_DWORD        0x10

Start               REG_DWORD        0x2

ErrorControl        REG_DWORD        0x1

ImagePath           REG_EXPAND_SZ    "C:\Program Files\Intel\SUR\QUEENCREEK\x64\esrv_svc.exe" "--AUTO_START" "--start" "--start_options_registry_key" "HKEY_LOCAL_MACHINE\SYSTEM\CurrentControlSet\services\ESRV_SVC_QUEENCREEK\_start"

DisplayName         REG_SZ           Energy Server Service queencreek

ObjectName          REG_SZ           LocalSystem

_start              REG_EXPAND_SZ    "--START" "--output_folder" "%LOCAL_APP_DATA%\Intel\SUR\QUEENCREEK\collected_data" "--depend_on_key" "SOFTWARE\Intel\SUR\ICIP_RUN" "--depend_on_folder" "%LOCAL_APP_DATA%\Intel\SUR\QUEENCREEK\intermediate_data" "--depend_on_folder_size_less_than" "262144000" "--depend_on_folder_files_count_less_than" "300" "--depend_on_folder_depth_less_than" "20" "--depend_on_folder_scan_time_less_than" "40000" "--depend_check_period" "3600000" "--address" "127.0.0.1" "--port" "49350" "--do_not_generate_dump_files" "--time_in_ms" "--pause" "5000" "--watchdog" "5" "--watchdog_cpu_usage_limit" "50" "--end_on_error" "--priority_boost" "--kernel_priority_boost" "--shutdown_priority_boost" "--do_not_use_system_error_logs" "--library" "C:\Program Files\Intel\SUR\QUEENCREEK\x64\intel_modeler.dll" "--no_pl" "--resume_delay" "30000" "--device_options" " time=no  generate_key_file=no performance=no in_cycle_performance=no output=w output_folder='%LOCAL_APP_DATA%\Intel\SUR\QUEENCREEK\intermediate_data' upload_folder='%LOCAL_APP_DATA%\Intel\SUR\QUEENCREEK\collected_data' lock_xls=yes deferred_logger_stop=yes il='C:\Program Files\Intel\SUR\QUEENCREEK\x64\intel_acpi_battery_input.dll','start_at=6' il='C:\Program Files\Intel\SUR\QUEENCREEK\x64\intel_wifi_input.dll' il='C:\Program Files\Intel\SUR\QUEENCREEK\x64\devices_use_input.dll','service=yes enumerate_pid=yes' il='C:\Program Files\Intel\SUR\QUEENCREEK\x64\intel_system_power_state_input.dll','numsamples_to_buffer=6 clock=5000 delayed_resume=30000' il='C:\Program Files\Intel\SUR\QUEENCREEK\x64\intel_os_input.dll','clock=5000 threads=auto configuration_file=C:\Program Files\Intel\SUR\QUEENCREEK\x64\sur_os_counters.txt optimize=yes auto_min_tick=10 auto_tick_gap=5' il='C:\Program Files\Intel\SUR\QUEENCREEK\x64\intel_phat_input.dll','delay=1000 always_log_phat_metadata=YES extract_phat_on_new_boot_only=YES' il='C:\Program Files\Intel\SUR\QUEENCREEK\x64\intel_process_input.dll','configuration_file=C:\Program Files\Intel\SUR\QUEENCREEK\x64\process_input_options.txt' il='C:\Program Files\Intel\SUR\QUEENCREEK\x64\intel_hw_input.dll','configuration_file=C:\Program Files\Intel\SUR\QUEENCREEK\x64\sur_hw_config.txt' il='C:\Program Files\Intel\SUR\QUEENCREEK\x64\intel_etw_input.dll','configuration_file=C:\Program Files\Intel\SUR\QUEENCREEK\x64\etw_options_config.txt' il='C:\Program Files\Intel\SUR\QUEENCREEK\x64\intel_crashlog_input.dll','start_at=12 nogpr_cpusig_count=3 read_sampling_count_max=200 configuration_file=C:\Program Files\Intel\SUR\QUEENCREEK\x64\crashlog_options.txt ' il='C:\Program Files\Intel\SUR\QUEENCREEK\x64\intel_fps_input.dll','clock=5000' il='C:\Program Files\Intel\SUR\QUEENCREEK\x64\intel_heartbeat_input.dll','service=yes' il='C:\Program Files\Intel\SUR\QUEENCREEK\x64\intel_csme_input.dll','start_at=8' il='C:\Program Files\Intel\SUR\QUEENCREEK\x64\intel_process_watcher_input.dll','override=yes configure=yes generate_samples=yes enumeration=no enumeration_delay=10000 enumeration_pause=250' ll='C:\Program Files\Intel\SUR\QUEENCREEK\x64\sql_logger.dll','db_differential_elaspsed_time=yes db_wal=yes db_wal_autocheckpoint=0 db_cache=yes db_cache_size=auto db_max_page_count=300000 db_synchronous=off db_journal_mode=off db_locking_mode=exclusive+ delayed_dctl=summarize dctl_process_delay=5000' "

DelayedAutostart    REG_DWORD          0x1

description         REG_SZ             Intel(r) Energy Checker SDK. ESRV Service queencreek

run                 REG_DWORD          0x1

This command line has a lot of DLL paths and configuration options. There are some interesting persistence options here (which require running as admin) – replace any of the DLLs in the command with your own DLLs and you’ll get code execution when the service starts. This service also uses some batch and VBS files which are executed on installation, update and uninstallation. Those have some other interesting persistence options, though they also require admin privileges to use.

But the parts relevant to my system crashes are the configuration flags. First, thedo_not_generate_dump_files flag might be the one responsible for the lack of dump files after system crashes. Second, the --watchdog_cpu_usage_limit 50 flag might be responsible for the crashes themselves by crashing the system when the CPU usage gets too high.

To try and resolve the issue I disabled this service and all its related services. It did make my system crash less, but didn’t stop the crashes completely, so looks like this was only part of the problem. Crash dump generation didn’t resume, so my guess was wrong (later on I learned that it might be a bug in securekernel.exe causing that issue).

This investigation didn’t have a very satisfying resolution, as I didn’t find a complete fix for the repeated crashes or lack of memory dumps (yet!). But I thought the research process itself might be interesting enough to publish it, and hopefully it’ll help some other people.

KASLR Leaks Restriction

In recent years, Microsoft has focused its efforts on mitigating bug classes and exploitation techniques. In latest Windows versions this includes another change that adds a significant challenge to attackers targeting the Windows kernel — restricting kernel address leaks to user mode. With almost any memory bugs, an attacker needs some kernel address leak to know which address will be read / written into / overflowed / corrupted. That address could be the address of ntoskrnl.exe or other kernel drivers, or the address of some object that the attacker targets. Until recently, getting those was very easy (for anyone running at medium integrity level or above). All you had to do was call one of several known windows APIs.

But starting Windows 11 / Windows Server 2022 24H2 edition, those APIs will no longer leak any kernel addresses, unless the requesting process has enabled SeDebugPrivilege, a powerful privilege which is only available to admin processes and not enabled by default. This check is implemented with a new flag passed to ExIsRestrictedCaller:

ExIsRestrictedCaller is called in various places in the kernel to check whether a process should receive access to a resource or be allowed to perform an operation. This is used to restrict processes running with an integrity level of Low or Untrusted from calling APIs that return kernel addresses, for example. Now, this API also checks if the process enables SeDebugPrivilege and uses the result to set the RestrictKernelAddressLeaks argument (name chosen by me, as the argument name is not public) and return it to the caller. This argument is then used by the caller to decide what kernel data can be returned to the user-mode caller.

For example, when NtQuerySystemInformation (which calls the internal ExpQuerySystemInformation) is called with the SystemModuleInformation class, ExIsRestrictedCaller is called to determine what data the caller can receive. The output argument then gets passed into ExpQueryModuleInformation:

Inside ExpQueryModuleInformation, the RestrictKernelAddressLeaks argument is used to decide whether the function will populate the DllBase field for every kernel module loaded in the system:

If the argument is set, which means the process does not enable SeDebugPrivilege, the process will still be able to receive information about the loaded kernel modules. But that information will not include the base address of those modules – that field will be set to 0.

This check is done in all other APIs known to leak kernel addresses to user-mode callers. In all cases, the query will succeed for callers running at Medium IL or above, but the fields that normally contain kernel addresses will be left empty. The full list of APIs which now restrict kernel address leaks are:

APIInformation ClassData Structure Returned by the APIRestricted Field
NtQuerySystemInformationSystemModuleInformation (11)RTL_PROCESS_MODULE_INFORMATIONRTL_PROCESS_MODULE_INFORMATION.DllBase
NtQuerySystemInformationSystemLocksInformation (12)RTL_PROCESS_LOCK_INFORMATIONRTL_PROCESS_LOCK_INFORMATION.Address
NtQuerySystemInformationSystemHandleInformation (16)SYSTEM_HANDLE_INFORMATIONSYSTEM_HANDLE_INFORMATION.Handles[N].Object
NtQuerySystemInformationSystemObjectInformation (17)SYSTEM_OBJECT_INFORMATIONSYSTEM_OBJECT_INFORMATION.Object
NtQuerySystemInformationSystemExtendedHandleInformation (64)SYSTEM_HANDLE_INFORMATION_EXSYSTEM_HANDLE_INFORMATION_EX.Handles[N].Object
NtQuerySystemInformationSystemBigPoolInformation (66)SYSTEM_BIGPOOL_INFORMATIONSYSTEM_BIGPOOL_INFORMATION.AllocationInfo[N].VirtualAddress
NtQuerySystemInformationSystemModuleInformationEx (77)RTL_PROCESS_MODULE_INFORMATION_EXRTL_PROCESS_MODULE_INFORMATION_EX.BaseInfo.ImageBase
NtQuerySystemInformationSystemFullProcessInformation (148)The undocumented SYSTEM_FULL_PROCESS_INFORMATION structure contains: SYSTEM_PROCESS_INFORMATION + array of SYSTEM_THREAD_EXTENDED_THREAD_INFORMATION + SYSTEM_PROCESS_INFORMATION_EXTENSIONSYSTEM_EXTENDED_THREAD_INFORMATION.StackBase

SYSTEM_EXTENDED_THREAD_INFORMATION.Win32StartAddress if the thread’s Win32StartAddress is a kernel address.

SYSTEM_EXTENDED_THREAD_INFORMATION.ThreadInfo.StartAddress
NtQueryInformationProcessProcessHandleTracing (32)PROCESS_HANDLE_TRACING_QUERYPROCESS_HANDLE_TRACING_QUERY.HandleTrace[N].Stacks
NtQueryInformationProcessProcessWorkingSetWatchEx (42)PROCESS_WS_WATCH_INFORMATION_EXPROCESS_WS_WATCH_INFORMATION_EX.BasicInfo.FaultingPc – if FaultingPc is a kernel address.

PROCESS_WS_WATCH_INFORMATION_EX.BasicInfo.FaultingVa – if FaultingVa is a kernel address.

Are these APIs the only ways to leak kernel addresses? Are KASLR leaks finally dead? Of course not. But more on that in another blog post 🙂

Investigating Filter Communication Ports

If you spent any time writing or researching filter drivers, you may have run into filter communication ports. This is a standard communication method between a filter driver and its user-mode process, implemented and managed by the filter manager (FltMgr.sys). The ports allow the process and the drivers to send messages back and forth. Ports are named, so that processes can easily find and connect to them, and they allow the filter driver to decide who can get access to the port through a security descriptor, a maximum connection number field and a method that gets invoked whenever a new connection attempt is made, allowing the driver to dynamically allow or deny a specific connection request.

If you’re interested in learning how to create and use communication ports, I recommend taking a look at the Windows Driver Samples Github repository. In this post, I’ll focus on the forensics side and see how we can investigate filter communication ports to get some interesting information. Specifically, I’ll show how we can answer two questions:

  1. How can we find out what communication ports a filter driver created?
  2. Which user-mode processes are connected to a communication port?

As usual, I conduct my investigation in WinDbg kernel debugging session.

Finding Communication Ports

We can answer the first question easily. To find out what ports are created by a filter driver we can use the FltKd extension – one of the many useful debugger extensions provided in the SDK. This extension DLL isn’t always loaded by default so you might have to manually load the DLL into the debugger with the .load command. The DLL should be in "C:\Program Files (x86)\Windows Kits\10\Debuggers\x64\winxp\fltkd.dll" if you are using the legacy debugger or under the WinDbg Preview installation path if you are using Preview.

FltKd has several useful commands to debug filter drivers (you can see them all by running !fltkd.help). The first command will use is !fltkd.filters, which shows all the registered filters in the system:

!fltkd.filters

Filter List: ffff9c8f51af0320 "Frame 0"
    FLT_FILTER: ffff9c8f5bce7010 "bindflt" "409800"
      FLT_INSTANCE: ffff9c8f6aa51010 "bindflt Instance" "409800"
   FLT_FILTER: ffff9c8f55b86ba0 "FsDepends" "407000"
      FLT_INSTANCE: ffff9c8f554c1b40 "FsDepends" "407000"
      FLT_INSTANCE: ffff9c8f554ca6a0 "FsDepends" "407000"
      FLT_INSTANCE: ffff9c8f68fd2010 "FsDepends" "407000"
      FLT_INSTANCE: ffff9c8f68fea930 "FsDepends" "407000"
      FLT_INSTANCE: ffff9c8f68fea4a0 "FsDepends" "407000"
      FLT_INSTANCE: ffff9c8f68fea010 "FsDepends" "407000"
   FLT_FILTER: ffff9c8f53d3dab0 "WdFilter" "328010"
      FLT_INSTANCE: ffff9c8f53eb48a0 "WdFilter Instance" "328010"
      FLT_INSTANCE: ffff9c8f551398e0 "WdFilter Instance" "328010"
      FLT_INSTANCE: ffff9c8f553858e0 "WdFilter Instance" "328010"
      FLT_INSTANCE: ffff9c8f55643010 "WdFilter Instance" "328010"
      FLT_INSTANCE: ffff9c8f5573d8e0 "WdFilter Instance" "328010"
      FLT_INSTANCE: ffff9c8f5577c8a0 "WdFilter Instance" "328010"
      FLT_INSTANCE: ffff9c8f5a3d38a0 "WdFilter Instance" "328010"
   FLT_FILTER: ffff9c8f627d1ba0 "storqosflt" "244000"
   FLT_FILTER: ffff9c8f5a6d7030 "wcifs" "189900"
      FLT_INSTANCE: ffff9c8f6add9010 "wcifs Outer Instance" "189899"
   FLT_FILTER: ffff9c8f62eee8a0 "CldFlt" "180451"
      FLT_INSTANCE: ffff9c8f557b8010 "CldFlt" "180451"
   FLT_FILTER: ffff9c8f628cbba0 "bfs" "150000"
      FLT_INSTANCE: ffff9c8f55734b00 "bfs" "150000"
      FLT_INSTANCE: ffff9c8f5a7e0ba0 "bfs" "150000"
      FLT_INSTANCE: ffff9c8f5a7e1ba0 "bfs" "150000"
      FLT_INSTANCE: ffff9c8f627ee8a0 "bfs" "150000"
      FLT_INSTANCE: ffff9c8f627ed8a0 "bfs" "150000"
      FLT_INSTANCE: ffff9c8f627ec8a0 "bfs" "150000"
      FLT_INSTANCE: ffff9c8f627eb8a0 "bfs" "150000"
      FLT_INSTANCE: ffff9c8f627ea8a0 "bfs" "150000"
      FLT_INSTANCE: ffff9c8f627e98a0 "bfs" "150000"
   FLT_FILTER: ffff9c8f550d4c60 "FileCrypt" "141100"
   FLT_FILTER: ffff9c8f5a85e010 "luafv" "135000"
      FLT_INSTANCE: ffff9c8f629cf010 "luafv" "135000"
   FLT_FILTER: ffff9c8f552e8c40 "npsvctrig" "46000"
      FLT_INSTANCE: ffff9c8f5516d8a0 "npsvctrig" "46000"
   FLT_FILTER: ffff9c8f53d38a00 "Wof" "40700"
      FLT_INSTANCE: ffff9c8f5510b8a0 "Wof Instance" "40700"
      FLT_INSTANCE: ffff9c8f5569f8a0 "Wof Instance" "40700"
      FLT_INSTANCE: ffff9c8f5572c8e0 "Wof Instance" "40700"
      FLT_INSTANCE: ffff9c8f5574a8a0 "Wof Instance" "40700"
   FLT_FILTER: ffff9c8f53d3b8a0 "FileInfo" "40500"
      FLT_INSTANCE: ffff9c8f53ea28a0 "FileInfo" "40500"
      FLT_INSTANCE: ffff9c8f550d58a0 "FileInfo" "40500"
      FLT_INSTANCE: ffff9c8f55364010 "FileInfo" "40500"
      FLT_INSTANCE: ffff9c8f556486e0 "FileInfo" "40500"
      FLT_INSTANCE: ffff9c8f556cd8a0 "FileInfo" "40500"
      FLT_INSTANCE: ffff9c8f557458a0 "FileInfo" "40500"
      FLT_INSTANCE: ffff9c8f5a3c9730 "FileInfo" "40500"

This command enumerates the frames in FLTMGR!FltGlobals, then enumerates the filters registered for each frame. We could recreate this with DX if we wanted to but for now the FltKd output is good enough.

Our next step is to find all the ports registered by a filter driver. We can use FltKd for this as well, with the fltkd.portlist command. For this exercise we’ll pick the Windows Defender filter driver, wdfilter:

!fltkd.portlist 0xffff9c8f53d3dab0
 FLT_FILTER: ffff9c8f53d3dab0    Client Port List         : Mutex (ffff9c8f53d3dd08) List [ffff9c8f6b6312f0-ffff9c8f6b633270] mCount=5
       FLT_PORT_OBJECT: ffff9c8f6b6312f0
          FilterLink               : [ffff9c8f6b630870-ffff9c8f53d3dd40]
          ServerPort               : ffff9c8f524f3420
          Cookie                   : ffff9c8f53d3e108
          Lock                     : (ffff9c8f6b631318)
          MsgQ                     : (ffff9c8f6b631350)  NumEntries=0 Enabled
          MessageId                : 0x0000000000000000
          DisconnectEvent          : (ffff9c8f6b631428)
          Disconnected             : FALSE
       FLT_PORT_OBJECT: ffff9c8f6b630870
          FilterLink               : [ffff9c8f6b634770-ffff9c8f6b6312f0]
          ServerPort               : ffff9c8f524f4550
          Cookie                   : ffff9c8f53d3e148
          Lock                     : (ffff9c8f6b630898)
          MsgQ                     : (ffff9c8f6b6308d0)  NumEntries=8 Enabled
          MessageId                : 0x0000000000000000
          DisconnectEvent          : (ffff9c8f6b6309a8)
          Disconnected             : FALSE
       FLT_PORT_OBJECT: ffff9c8f6b634770
          FilterLink               : [ffff9c8f6b634cb0-ffff9c8f6b630870]
          ServerPort               : ffff9c8f524f44a0
          Cookie                   : ffff9c8f53d3e138
          Lock                     : (ffff9c8f6b634798)
          MsgQ                     : (ffff9c8f6b6347d0)  NumEntries=16 Enabled
          MessageId                : 0x0000000000000000
          DisconnectEvent          : (ffff9c8f6b6348a8)
          Disconnected             : FALSE
       FLT_PORT_OBJECT: ffff9c8f6b634cb0
          FilterLink               : [ffff9c8f6b633270-ffff9c8f6b634770]
          ServerPort               : ffff9c8f524f3840
          Cookie                   : ffff9c8f53d3e118
          Lock                     : (ffff9c8f6b634cd8)
          MsgQ                     : (ffff9c8f6b634d10)  NumEntries=16 Enabled
          MessageId                : 0x000000000000a3c1
          DisconnectEvent          : (ffff9c8f6b634de8)
          Disconnected             : FALSE
       FLT_PORT_OBJECT: ffff9c8f6b633270
          FilterLink               : [ffff9c8f53d3dd40-ffff9c8f6b634cb0]
          ServerPort               : ffff9c8f524f3e70
          Cookie                   : ffff9c8f53d3e128
          Lock                     : (ffff9c8f6b633298)
          MsgQ                     : (ffff9c8f6b6332d0)  NumEntries=2 Enabled
          MessageId                : 0x0000000000001e98
          DisconnectEvent          : (ffff9c8f6b6333a8)
          Disconnected             : FALSE

Great, we found five ports created by wdfilter! However, in this case, we probably do want to try and get this information with a DX command and not settle for the legacy extension output. That’s because the output of legacy extension commands can’t be enumerated or operated on and there’s no legacy command that answers our second question. This means that to find the connected process we’d have to operate on each port separately, resulting in a lot of manual steps. If we want to automate the process, we should get this information with the debugger data model and save the ports in a variable that we can use for our other commands.

Each filter driver is managed through a FLT_FILTER structure. This structure contains all the management information for the filter, including the list of all its communication ports, linked in its PortList field. The data for each port is saved in a FLT_PORT_OBJECT structure. Conveniently, we got the addresses of the FLT_FILTER structures for all the registered filters from our earlier command – !fltkd.filters. So let’s take the address of the wdfilter FLT_FILTER structure, and use DX to parse the port list. To make this easier to use later, I’ll create a helper function to do this, and also save the wdfilter address in a variable:

dx @$enumPortsForFilter = (filter => Debugger.Utility.Collections.FromListEntry(((fltmgr!_FLT_FILTER*)filter)->PortList.mList, "fltmgr!_FLT_PORT_OBJECT", "FilterLink"))

dx @$wdfilter = 0xffff9c8f53d3dab0

Now we can call the function and get all the ports registered by the driver, and save them in a variable that we will use in the rest of the post:

dx @$wdfilterports = @$enumPortsForFilter(@$wdfilter)
@$wdfilterports = @$enumPortsForFilter(@$wdfilter)
   [0x0]            [Type: _FLT_PORT_OBJECT]
   [0x1]            [Type: _FLT_PORT_OBJECT]
   [0x2]            [Type: _FLT_PORT_OBJECT]
   [0x3]            [Type: _FLT_PORT_OBJECT]
   [0x4]            [Type: _FLT_PORT_OBJECT]

Before we get to the second part of the question and try to find the processes using each port, there’s one more piece of information we might want to find about each port: its name. To do that, we need to look at the port structure itself, since the communication ports we retrieved aren’t named, as we can see with the !object command:

dx -r0 &@$wdfilterports.First()
&@$wdfilterports.First()                 : 0xffff9c8f6b6312f0 [Type: _FLT_PORT_OBJECT *]

!object 0xffff9c8f6b6312f0
Object: ffff9c8f6b6312f0  Type: (ffff9c8f4f0f5f00) FilterCommunicationPort
    ObjectHeader: ffff9c8f6b6312c0 (new version)
    HandleCount: 1  PointerCount: 3

Instead, we need to look at the ServerPort field of the FLT_PORT_OBJECT, which points to a connection port object that represents the driver’s connection to the port:

dx -r0 @$wdfilterports.First().ServerPort
@$wdfilterports.First().ServerPort                 : 0xffff9c8f524f3420 [Type: _FLT_SERVER_PORT_OBJECT *]

!object 0xffff9c8f524f3420
Object: ffff9c8f524f3420  Type: (ffff9c8f4f0f5400) FilterConnectionPort
    ObjectHeader: ffff9c8f524f33f0 (new version)
    HandleCount: 1  PointerCount: 3
    Directory Object: ffffd584ae22c930  Name: MicrosoftMalwareProtectionControlPortWD

Now we found the port’s name – MicrosoftMalwareProtectionControlPortWD. We can run !object on the server port for each of the communication ports and find the name for all of them as well. This can be automated with dx and the ExecuteCommand routine, but if you are running a modern build of WinDbg you can just find the object header of the connection port and access the ObjectName field to retrieve the name. This field isn’t actually a part of the OBJECT_HEADER structure, but in modern builds the debugger data model parses the name and adds it as a synthetic field. Unfortunately, the debugger data model doesn’t supply us with an easy way to get the address of the header for a given object and hard-coding offsets isn’t ideal, so we’ll use the C++ #FIELD_OFFSET macro to save the offset in a register and use it in our DX command. Then we can quickly get the name for each port created by wdfilter:

r? @$t1 = #FIELD_OFFSET(nt!_OBJECT_HEADER, Body)
dx @$wdfilterports.Select(p => ((nt!_OBJECT_HEADER*)((__int64)p.ServerPort - @$t1))->ObjectName)
@$wdfilterports.Select(p => ((nt!_OBJECT_HEADER*)((__int64)p.ServerPort - @$t1))->ObjectName)
    [0x0]            : "MicrosoftMalwareProtectionControlPortWD"
    [0x1]            : "MicrosoftMalwareProtectionAsyncPortWD"
    [0x2]            : "MicrosoftMalwareProtectionRemoteIoPortWD"
    [0x3]            : "MicrosoftMalwareProtectionPortWD"
    [0x4]            : "MicrosoftMalwareProtectionVeryLowIoPortWD"

If you are using an older build of WinDbg you may not have the ObjectName field automatically added and need to parse it yourselves. The process of doing that is a bit ugly and also not the topic of this post so I’ll skip this step and just recommend that you use the latest version of the debugger.

Alternatively, we could have skipped this whole part of the post and use the search function of WinObjEx to search for all FilterConnectionPort objects and look at each individual one to find which driver created it:

But tools like WinObjEx aren’t always available (for example, when you analyze a crash dump and don’t have access to the live machine) and besides, we can only answer the second part of the question using a kernel debugger. So, let’s try to find out who is connected to all these ports.

Finding the Connected Process

The first step when finding the connected processes is to check if there are any connected processes at all. This information is easy to find, we just need to look at the NumberOfConnections field of the server connection port:

dx @$wdfilterports.Select(p => p.ServerPort->NumberOfConnections)
@$wdfilterports.Select(p => p.ServerPort->NumberOfConnections)
    [0x0]            : 1 [Type: long]
    [0x1]            : 1 [Type: long]
    [0x2]            : 1 [Type: long]
    [0x3]            : 1 [Type: long]
    [0x4]            : 1 [Type: long]

Looks like all the Windows Defender ports have one process connected to them (and if you look at the MaxConnections field you’ll see that’s the most each of them can have). But how can we find out which process that is? Unfortunately, the connected process isn’t linked to the port itself, or, in fact, saved anywhere. So, there is no easy way to find the information we’re looking for. But obviously the system must have a way to link the connected process to the port in order to pass messages between the driver and the process, so let’s follow the trails.

To connect to a communication port, a process needs to call FilterConnectCommunicationPort. It receives a handle to the port, which it can use to send or receive messages. This handle is not a handle to a FilterConnectionPort object, but rather to a file object. As James Forshaw explains in this excellent Project Zero blog post:

In FltCreateCommunicationPort the filter manager creates a new named kernel object of type FilterConnectionPort with the OBJECT_ATTRIBUTES and associates it with the callbacks. There’s no NtOpenFilterConnectionPort system call to open a port. Instead when a user wants to access the port it must first open a handle to the filter manager message device object, \FileSystem\Filters\FltMgrMsg, passing an extended attributes structure identifying the full OMNS path to the port.

It is much easier to open a port by calling the FilterConnectCommunicationPort API in user-mode, so you don’t need to deal with connecting manually. When opening a port you can also specify an arbitrary context buffer to pass to the connect callback. This can be used to configure the open port instance. On connection the connect notification callback passed to FltCreateCommunicationPort will be called.

Every opened handle to a communication port is linked to the device \FileSystem\Filters\FltMgrMsg, so we could search for all handles to this device and find the processes that interact with communication ports. We can start by using the search function of System Informer:

This is a good start, but this still isn’t giving us the full picture. First, we don’t necessarily see the handles for every process, since I’m running System Informer without loading its driver, so it doesn’t have visibility into protected processes. Also, this also doesn’t tell us which port (or ports) each process is connected to. But with this knowledge we can go back into the debugger and hunt for handles to this device, then see how we can find the connection back to the port itself.

In the debugger, we can’t just search for handles to the device itself since each new connection receives a handle to a unique file object which points to the device. Unfortunately, these file objects aren’t named, making them a bit more complicated to search for (don’t be confused by the System Informer results, there is a lot going on behind the scenes there to get the correct name for each file). However, these FILE_OBJECTs have a DeviceObject field that should point to the FltMgrMsg device. Getting the address of the device is easy – we can just use the !object command to search for it by name:

!object \FileSystem\Filters\FltMgrMsg
Object: ffff9c8f518ec960  Type: (ffff9c8f4ef646c0) Device
    ObjectHeader: ffff9c8f518ec930 (new version)
    HandleCount: 0  PointerCount: 2
    Directory Object: ffffd584aec0f3e0  Name: FltMgrMsg

For convenience, I’ll save the object’s address in a variable:

dx @$fltmgrmsg = 0xffff9c8f518ec960

And write a helper function to search for file objects pointing to this device in a process’ handle table:

dx @$fltmgrmsgHandles = (p => p.Io.Handles.Where(h => h.Type == "File" && h.Object.UnderlyingObject.DeviceObject == @$fltmgrmsg))

Just to test it out, I’ll give it the OneDrive.exe process that we’ve seen in System Informer, since we already know it should have open handles to this device:

dx -r2 @$fltmgrmsgHandles(@$cursession.Processes[12696])
@$fltmgrmsgHandles(@$cursession.Processes[12696])
    [0x5f8]
        Handle           : 0x5f8
        Type             : File
        GrantedAccess    : Synch | Read/List | Write/Add
        Object           [Type: _OBJECT_HEADER]
    [0xc34]</code
        Handle           : 0xc34
        Type             : File
        GrantedAccess    : Synch | Read/List | Write/Add
        Object           [Type: _OBJECT_HEADER]

We got two results, the same ones we saw in System Informer! Now, how do we get from here to the ports themselves? To link between a file handle and the related port we need to look at the underlying FILE_OBJECT and its FsContext2 field, which point to the CCB, or the Context Control Block. This field contains additional information about the file object, including a Port field:

dx ((fltmgr!_FLT_CCB*)(@$fltmgrmsgHandles(@$cursession.Processes[12696]).First().Object.UnderlyingObject.FsContext2))->Data
((fltmgr!_FLT_CCB*)(@$fltmgrmsgHandles(@$cursession.Processes[12696]).First().Object.UnderlyingObject.FsContext2))->Data                 [Type: <unnamed-tag>]
    [+0x000] Manager          [Type: _MANAGER_CCB]
    [+0x000] Filter           [Type: _FILTER_CCB]
    [+0x000] Instance         [Type: _INSTANCE_CCB]
    [+0x000] Volume           [Type: _VOLUME_CCB]
    [+0x000] Port             [Type: _PORT_CCB]

In the Port field we can find a pointer to a communication port:

dx ((fltmgr!_FLT_CCB*)(@$fltmgrmsgHandles(@$cursession.Processes[12696]).First().Object.UnderlyingObject.FsContext2))->Data.Port
((fltmgr!_FLT_CCB*)(@$fltmgrmsgHandles(@$cursession.Processes[12696]).First().Object.UnderlyingObject.FsContext2))->Data.Port                 [Type: _PORT_CCB]
    [+0x000] Port             : 0xffff9c8f6b6433b0 [Type: _FLT_PORT_OBJECT *]
    [+0x008] ReplyWaiterList  [Type: _FLT_MUTEX_LIST_HEAD]

And once again, if we grab the ServerPort from the communication port, we can find the port name:

dx -r0 ((fltmgr!_FLT_CCB*)(@$fltmgrmsgHandles(@$cursession.Processes[12696]).First().Object.UnderlyingObject.FsContext2))->Data.Port.Port->ServerPort
((fltmgr!_FLT_CCB*)(@$fltmgrmsgHandles(@$cursession.Processes[12696]).First().Object.UnderlyingObject.FsContext2))->Data.Port.Port->ServerPort                 : 0xffff9c8f5b1afa20 [Type: _FLT_SERVER_PORT_OBJECT *]

!object 0xffff9c8f5b1afa20
Object: ffff9c8f5b1afa20  Type: (ffff9c8f4f0f5400) FilterConnectionPort
    ObjectHeader: ffff9c8f5b1af9f0 (new version)
    HandleCount: 1  PointerCount: 5
    Directory Object: ffffd584ae22c930  Name: CLDMSGPORT

We now know how to get from a file handle to the name of the communication port, so we can follow the same path for all processes that opened handles to communication ports. We can implement that as debugger data model queries in WinDbg, but scanning all the handle tables for all processes is a bit slow, so I wrote the same logic in JavaScript:

function initializeScript()
{
    return [new host.functionAlias(GetFileHandlesToDevice, "DeviceFileHandles"),
            new host.apiVersionSupport(1, 6)];
}

function GetFileHandlesToDevice(Device)
{
    // Get easy access to the debug output method
    let dbgOutput = host.diagnostics.debugLog;

    // Loop over each process
    let processes = host.currentSession.Processes;
    let objHeaderType = host.getModuleType("nt", "_OBJECT_HEADER");
    let objHeaderOffset = objHeaderType.fields.Body.offset;
    for (let process of processes)
    {
        let handles = process.Io.Handles;
        try {
            for (let handle of handles) {
                try {
                    let fileObj = handle.Object.ObjectType;
                    if (fileObj === "File") {
                        if (host.parseInt64(handle.Object.UnderlyingObject.DeviceObject.address, 16).compareTo(Device) == 0)
                        {
                            let fscontext2 = handle.Object.UnderlyingObject.FsContext2.address;
                            let fltCcbType = host.getModuleType("FltMgr", "_FLT_CCB");
                            let port = host.createTypedObject(fscontext2, fltCcbType).Data.Port.Port;
                            let portObjHeader = host.createTypedObject(port.ServerPort.address.subtract(objHeaderOffset), objHeaderType);
                            dbgOutput("\tProcess ", process.Name, " has handle ", handle.Handle, " to port ", portObjHeader.ObjectName, "\n");
                        }
                    }

                } catch (e) {
                    dbgOutput("\tException parsing handle ", handle.Handle, "in process ", process.Name, "!\n");
                }
            }
        } catch (e) {
            dbgOutput("\tException parsing handle table for process ", process.Name, " PID ", process.Id, "!\n");
        }
    }
}

Running the script, we can find the handles to communication ports:

dx @$scriptContents.GetHandlesToDevice(@$fltmgrmsg)

We see here the three handles we saw in System Informer (all to the CLDMSGPORT port) and some handles that System Informer didn’t show us since they belong to MsMpEng.exe – the user-mode process belonging to Windows Defender, running as a PPL. Those five handles match the five ports created by wdfilter.

What Else Can We Learn About the Port?

At this point, we have a few pieces of information about each communication port in the system:

  1. The port’s name
  2. The driver that created the port
  3. The user-mode process or processes that are connected to the port

But we’re not done yet – these ports contain some more information that can tell us a little bit about how they are used. Every port can be used to send messages from the process to the driver or from the driver to the process, or both. Some ports are only used for unidirectional communication, and others are used in both directions. Knowing the direction of a port could help us tell if a port is used to send requests or commands to the driver, or to send information to the user-mode process (for example to pass data collected by the driver that should be sent to a server by the process).

Knowing if the driver expects to receive messages from the process is relatively easy – on port creation the driver can register a MessageNotifyCallback routine that will get called when a message is sent from the connected process. Registering this callback is optional, and if no callback is registered, the driver can’t receive any messages.

So, let’s get back to the wdfilterports variable that we created in the beginning of the post and, once again, look at all the ports registered by wdfilter. For each one, we’ll print the MessageNotify field of the server port and see if one is registered. Let’s also print the name of each port, so we can easily identify them:

r? @$t1 = #FIELD_OFFSET(nt!_OBJECT_HEADER, Body)
dx -g @$wdfilterports.Select(p => new {Name = ((nt!_OBJECT_HEADER*)((__int64)p.ServerPort - @$t1))->ObjectName, MessageNotify = p.ServerPort->MessageNotify})

Looks like out of the five registered ports, only one is configured to receive messages: MicrosoftMalwareProtectionControlPortWD. All the other ports seem to be informational ports, where communication only flows from the driver to the process. But MicrosoftMalwareProtectionControlPortWD might also send information to the user-mode process, we can’t know for sure. Yet.

To find out if anyone is expecting to receive messages from a communication port, we need to look at wait queues.

Every port has a message queue that allows threads to wait for new messages from the driver. This means that if we enumerate that wait queue, we can find out which ports have waiters that expect to receive messages. This doesn’t necessarily mean that the driver plans to send messages, but in most cases we can assume that someone waiting on the port means that messages will be sent from the driver at some point. Knowing which thread is waiting on a port can sometimes be helpful, but if it’s a worker thread (in case this is an asynchronous wait) it may not be.

If we look at the wait queue of a port, what we’ll find is a list of IRPs. These IRPs will be completed when a message is sent that fits the requirements of the waiting thread. The waiting thread will then be alerted and process the message. Usually, the processing thread calls FilterGetMessage in a loop, so after it finishes processing a message it will get right back into the wait queue.

To parse the wait queues, we go back to our list of ports and look at the MsgQ field. This is our message queue, which contains a WaiterQ field, that holds the list of pending IRPs:

dx -r2 @$wdfilterports.Select(p => p.MsgQ.WaiterQ)
@$wdfilterports.Select(p => p.MsgQ.WaiterQ)
     [0x0]            [Type: _FLT_MUTEX_LIST_HEAD]
         [+0x000] mLock            [Type: _FAST_MUTEX]
         [+0x038] mList            [Type: _LIST_ENTRY]
         [+0x048] mCount           : 0x0 [Type: unsigned long]
         [+0x048 ( 0: 0)] mInvalid         : 0x0 [Type: unsigned char]
     [0x1]            [Type: _FLT_MUTEX_LIST_HEAD]
         [+0x000] mLock            [Type: _FAST_MUTEX]
         [+0x038] mList            [Type: _LIST_ENTRY]
         [+0x048] mCount           : 0x10 [Type: unsigned long]
         [+0x048 ( 0: 0)] mInvalid         : 0x0 [Type: unsigned char]
     [0x2]            [Type: _FLT_MUTEX_LIST_HEAD]
         [+0x000] mLock            [Type: _FAST_MUTEX]
         [+0x038] mList            [Type: _LIST_ENTRY]
         [+0x048] mCount           : 0x20 [Type: unsigned long]
         [+0x048 ( 0: 0)] mInvalid         : 0x0 [Type: unsigned char]
     [0x3]            [Type: _FLT_MUTEX_LIST_HEAD]
         [+0x000] mLock            [Type: _FAST_MUTEX]
         [+0x038] mList            [Type: _LIST_ENTRY]
         [+0x048] mCount           : 0x20 [Type: unsigned long]
         [+0x048 ( 0: 0)] mInvalid         : 0x0 [Type: unsigned char]
     [0x4]            [Type: _FLT_MUTEX_LIST_HEAD]
         [+0x000] mLock            [Type: _FAST_MUTEX]
         [+0x038] mList            [Type: _LIST_ENTRY]
         [+0x048] mCount           : 0x4 [Type: unsigned long]
         [+0x048 ( 0: 0)] mInvalid         : 0x0 [Type: unsigned char]

The first (potentially) useful piece of information we can see here is mCount, telling us how many waiters are in the queue. The first port, MicrosoftMalwareProtectionControlPortWD, has an empty wait queue, meaning that no one is expecting to receive any messages from it. That probably means that this port is only used to send messages from the process to the driver (and at most receive an immediate reply, that doesn’t require any waiting), so the process has nothing to wait for. The other four ports do have several waiters expecting messages, so let’s see if we can find out the identity of these threads.

We start by parsing the list of IRPs linked in Port->MsgQ.WaiterQ.mList. This list links the IRPs through their Tail.Overlay.ListEntry field, and we can use DX to parse it. For anyone (like me) getting confused by all the structures, this diagram shows how all these data structures fit together:

And now we can write a helper function to parse the list of queued IRPs:

dx @$getIrpList = (port => Debugger.Utility.Collections.FromListEntry(((fltmgr!_FLT_PORT_OBJECT*)port)->MsgQ.WaiterQ.mList, "nt!_IRP", "Tail.Overlay.ListEntry"))

Now let’s call @$getIrpList for each port in the list and grab the thread address for every IRP. We can find that in Irp.Tail.Overlay.Thread, or just use Irp->CurrentThread, since the debugger data model adds a synthetic field for our convenience:

dx -r2 @$wdfilterports.Select(p => @$getIrpList(&p).Select(i => i->CurrentThread))
@$ports.Select(p => @$getIrpList(&p).Select(i => i->CurrentThread))
    [0x0]
    [0x1]
        [0x0]            : 0xffffc685acdb6080 [Type: _ETHREAD *]
        [0x1]            : 0xffffc685acdb6080 [Type: _ETHREAD *]
        [0x2]            : 0xffffc685acdb6080 [Type: _ETHREAD *]
        [0x3]            : 0xffffc685acdb6080 [Type: _ETHREAD *]
        [0x4]            : 0xffffc685acdb6080 [Type: _ETHREAD *]
        [0x5]            : 0xffffc685acdb6080 [Type: _ETHREAD *]
        [0x6]            : 0xffffc685acdb6080 [Type: _ETHREAD *]
        [0x7]            : 0xffffc685acdb6080 [Type: _ETHREAD *]
    [0x2]
        [0x0]            : 0xffffc685af203080 [Type: _ETHREAD *]
        [0x1]            : 0xffffc685af203080 [Type: _ETHREAD *]
        [0x2]            : 0xffffc685af203080 [Type: _ETHREAD *]
        [0x3]            : 0xffffc685af203080 [Type: _ETHREAD *]
        [0x4]            : 0xffffc685af203080 [Type: _ETHREAD *]
        [0x5]            : 0xffffc685af203080 [Type: _ETHREAD *]
        [0x6]            : 0xffffc685af203080 [Type: _ETHREAD *]
        [0x7]            : 0xffffc685af203080 [Type: _ETHREAD *]
        [0x8]            : 0xffffc685af203080 [Type: _ETHREAD *]
        [0x9]            : 0xffffc685af203080 [Type: _ETHREAD *]
        [0xa]            : 0xffffc685af203080 [Type: _ETHREAD *]
        [0xb]            : 0xffffc685af203080 [Type: _ETHREAD *]
        [0xc]            : 0xffffc685af203080 [Type: _ETHREAD *]
        [0xd]            : 0xffffc685af203080 [Type: _ETHREAD *]
        [0xe]            : 0xffffc685af203080 [Type: _ETHREAD *]
        [0xf]            : 0xffffc685af203080 [Type: _ETHREAD *]
    [0x3]         
        [0x0]            : 0xffffc685aae61080 [Type: _ETHREAD *]
        [0x1]            : 0xffffc685aae61080 [Type: _ETHREAD *]
        [0x2]            : 0xffffc685aae61080 [Type: _ETHREAD *]
        [0x3]            : 0xffffc685aae61080 [Type: _ETHREAD *]
        [0x4]            : 0xffffc685aae61080 [Type: _ETHREAD *]
        [0x5]            : 0xffffc685aae61080 [Type: _ETHREAD *]
        [0x6]            : 0xffffc685aae61080 [Type: _ETHREAD *]
        [0x7]            : 0xffffc685aae61080 [Type: _ETHREAD *]
        [0x8]            : 0xffffc685aae61080 [Type: _ETHREAD *]
        [0x9]            : 0xffffc685aae61080 [Type: _ETHREAD *]
        [0xa]            : 0xffffc685aae61080 [Type: _ETHREAD *]
        [0xb]            : 0xffffc685aae61080 [Type: _ETHREAD *]
        [0xc]            : 0xffffc685aae61080 [Type: _ETHREAD *]
        [0xd]            : 0xffffc685aae61080 [Type: _ETHREAD *]
        [0xe]            : 0xffffc685aae61080 [Type: _ETHREAD *]
        [0xf]            : 0xffffc685aae61080 [Type: _ETHREAD *]
    [0x4]             
        [0x0]            : 0xffffc685ada78080 [Type: _ETHREAD *]
        [0x1]            : 0xffffc685b0668080 [Type: _ETHREAD *]

It looks like we have a lot of duplicates here. This is normal, as the same thread might appear in multiple IRPs. Since we don’t care about each individual IRP, and only care about the threads themselves, we can clean up our view using the Distinct() method and get the thread ID for each thread. And then clean up our view even more by using SelectMany to flatten the array:

dx @$wdfilterports.SelectMany(p => @$getIrpList(&p).Select(i => i->CurrentThread).Distinct().Select(t => t->Cid.UniqueThread)) 
@$wdfilterports.SelectMany(p => @$getIrpList(&p).Select(i => i->CurrentThread).Distinct().Select(t => t->Cid.UniqueThread))                 
    [0x0]            : 0x31c4 [Type: void *] 
    [0x1]            : 0x13a8 [Type: void *] 
    [0x2]            : 0xc84 [Type: void *] 
    [0x3]            : 0xcb8 [Type: void *] 

We can also get the process ID to know which process hosts these threads, but we already know that the only process that’s connected to the Windows Defender ports is MsMpEng.exe so there’s no need. Finally, let’s put everything together and add the port name and message notify routine: 

r? @$t1 = #FIELD_OFFSET(nt!_OBJECT_HEADER, Body)
dx -g @$wdfilterports.Select(p => new {Name = ((nt!_OBJECT_HEADER*)((__int64)p.ServerPort - @$t1))->ObjectName, MessageNotify = p.ServerPort->MessageNotify, ListeningThreads = @$getIrpList(&p).Select(i => i->CurrentThread).Distinct().Count()})

There we have it. The first port is used to send messages to the driver, and the other four are used to send information back to the process. You can use these queries to find the thread IDs, analyze the call stacks and find the user-mode message handlers of each of the ports. This is especially cool when analyzing a crash dump of a suspicious machine, where there aren’t any tools to help us except the debugger.

Hope this post has been useful to at least some of you, and I hope to see more memory forensic scripts and methods in the future!

An End to KASLR Bypasses?

Edit: this post initially discussed the new changes only in the context of KASLR bypasses. In reality this new event covers other suspicious behaviors as well and the post was edited to reflect that. The title is left as it was for convenience.


In recent years, in addition to mitigating and patching specific malware or exploits, Microsoft is targeting bug classes. With a wide range of mitigations, such as zero-initialized pool allocations, CET, XFG and the most recent CastGuard, exploiting bugs is becoming more and more challenging. On top of that, there is improved visibility into malware and exploit techniques through ETW and specifically the Threat Intelligence ETW channel, available to EDRs.

In 23H2 preview builds, Microsoft is introducing a new ETW event, this time aimed at NT APIs that could point at various suspicious behaviors.

Syscall Usage Visibility

With this new change, Microsoft is focusing on several system calls that normally shouldn’t be used by many applications but might be used by exploits either in their pre- or post- exploitation stage for various purposes, such as KASLR bypasses, VM detection or physical memory access. Many of the cases covered by this new event are already restricted to privileged processes — some require privileges reserved to admin or system processes, others restricted to low IL or untrusted callers. But an attempt to call any of those system calls could indicate suspicious activity, so it could be interesting regardless.

Until now, the only way EDRs could detect this type of activity was to place user-mode hooks on all the different NtQuery functions that leak kernel pointers. For many reasons, this is not ideal. Microsoft has been trying to keep EDRs away from user-mode hooks for a while, mostly by adding ETW events that allow EDRs to consume the same information through non-invasive means (though asynchronously and with no blocking capabilities).

Keeping up with this trend, Windows 11 23H2 adds a new ETW event to the Threat Intelligence channel – THREATINT_PROCESS_SYSCALL_USAGE. This ETW event is generated to indicate that a non-admin process has made an API call to an API + information class that could indicate some unusual (and potentially malicious) activity. This event will be generated for information classes in two APIs:

  • NtQuerySystemInformation
  • NtSystemDebugControl

These APIs have many information classes and many of them are “innocent” and commonly used by many applications. To avoid spamming information that isn’t interesting or useful, the following information classes will generate an ETW event:

  • SystemModuleInformation
  • SystemModuleInformationEx
  • SystemLocksInformation
  • SystemStackTraceInformation
  • SystemHandleInformation
  • SystemExtendedHandleInformation
  • SystemObjectInformation
  • SystemBigPoolInformation
  • SystemExtendedProcessInformation
  • SystemSessionProcessInformation
  • SystemMemoryTopologyInformation
  • SystemMemoryChannelInformation
  • SystemCoverageInformation
  • SystemPlatformBinaryInformation
  • SystemFirmwareTableInformation
  • SystemBootMetadataInformation
  • SystemWheaIpmiHardwareInformation
  • SystemSuperfetchInformation + SuperfetchPrefetch
  • SystemSuperfetchInformation + SuperfetchPfnQuery
  • SystemSuperfetchInformation + SuperfetchPrivSourceQuery
  • SystemSuperfetchInformation + SuperfetchMemoryListQuery
  • SystemSuperfetchInformation + SuperfetchMemoryRangesQuery
  • SystemSuperfetchInformation + SuperfetchPfnSetPriority
  • SystemSuperfetchInformation + SuperfetchMovePages
  • SystemSuperfetchInformation + SuperfetchPfnSetPageHeat
  • SysDbgGetTriageDump
  • SysDbgGetLiveKernelDump

These information classes are included for different reasons – some are known to leak kernel addresses, some can be used for VM detection, another used in hardware persistence, and some indicate previous knowledge of physical memory that most applications should not have. Overall, this new event covers various indicators that an application isn’t behaving as it should.

Every mitigation must also take into consideration the potential performance impact, and ETW event generation can slow down the system when done in a code path that is called frequently. So, a few restrictions apply to this:

  1. The events will only be generated for user-mode non-admin callers. Since Admin->Kernel is not considered a boundary on Windows, many mitigations don’t apply to admin processes to lower the performance impact on the system.
  2. An event will only be generated once per information class for each process. This means if NtQuerySystemInformation is called 10 times by a single process, all with the same information class, only one ETW event will be sent.
  3. The event will only be sent if the call succeeded. Failed calls will be ignored and will not generate any events.

To support requirement 2 and keep track of which information class were involved by a process, a new field was added to the EPROCESS structure:

union
{
    unsigned long SyscallUsage;
    struct
    {
        struct /* bitfield */
        {
            unsigned long SystemModuleInformation : 1; /* bit position: 0 */
            unsigned long SystemModuleInformationEx : 1; /* bit position: 1 */
            unsigned long SystemLocksInformation : 1; /* bit position: 2 */
            unsigned long SystemStackTraceInformation : 1; /* bit position: 3 */
            unsigned long SystemHandleInformation : 1; /* bit position: 4 */
            unsigned long SystemExtendedHandleInformation : 1; /* bit position: 5 */
            unsigned long SystemObjectInformation : 1; /* bit position: 6 */
            unsigned long SystemBigPoolInformation : 1; /* bit position: 7 */
            unsigned long SystemExtendedProcessInformation : 1; /* bit position: 8 */
            unsigned long SystemSessionProcessInformation : 1; /* bit position: 9 */
            unsigned long SystemMemoryTopologyInformation : 1; /* bit position: 10 */
            unsigned long SystemMemoryChannelInformation : 1; /* bit position: 11 */
            unsigned long SystemCoverageInformation : 1; /* bit position: 12 */
            unsigned long SystemPlatformBinaryInformation : 1; /* bit position: 13 */
            unsigned long SystemFirmwareTableInformation : 1; /* bit position: 14 */
            unsigned long SystemBootMetadataInformation : 1; /* bit position: 15 */
            unsigned long SystemWheaIpmiHardwareInformation : 1; /* bit position: 16 */
            unsigned long SystemSuperfetchPrefetch : 1; /* bit position: 17 */
            unsigned long SystemSuperfetchPfnQuery : 1; /* bit position: 18 */
            unsigned long SystemSuperfetchPrivSourceQuery : 1; /* bit position: 19 */
            unsigned long SystemSuperfetchMemoryListQuery : 1; /* bit position: 20 */
            unsigned long SystemSuperfetchMemoryRangesQuery : 1; /* bit position: 21 */
            unsigned long SystemSuperfetchPfnSetPriority : 1; /* bit position: 22 */
            unsigned long SystemSuperfetchMovePages : 1; /* bit position: 23 */
            unsigned long SystemSuperfetchPfnSetPageHeat : 1; /* bit position: 24 */
            unsigned long SysDbgGetTriageDump : 1; /* bit position: 25 */
            unsigned long SysDbgGetLiveKernelDump : 1; /* bit position: 26 */
            unsigned long SyscallUsageValuesSpare : 5; /* bit position: 27 */
        }; /* bitfield */
    }  SyscallUsageValues;
};

The first time a process successfully invokes one of the monitored information classes, the bit corresponding to that information class is set – this happens for admin processes, even if the ETW event isn’t sent for those processes. An ETW event is only sent if the bit is not set, guaranteeing that an event is only sent once for every class. And while there is no API to query this EPROCESS field, it does have the nice side effect of leaving a record of which information classes are used by each process – something to look at if you analyze a system! (But only if the Syscall Usage event is enabled in the system, otherwise the bits don’t get set).

Examining the Data

Currently nothing is enabling this event, and no one consumes it, but I expect to see Windows Defender start using it soon, and hopefully other EDRs as well. I went and enabled this event manually to see whether those “suspicious” APIs get used on a regular machine, using my I/O ring exploit as a sanity test (since I know it uses NtQuerySystemInformation to leak kernel pointers). Here are some of the results from a few minutes of normal execution:

dx -g @$cursession.Processes.Where(p => p.KernelObject.SyscallUsage).Select(p => new {Name = p.Name, SyscallUsage = p.KernelObject.SyscallUsage})

Obviously, there are a few information classes that are used pretty frequently on the machine, with the main one (so far) being SystemFirmwareTableInformation. Those common classes might get ignored by EDRs early on, and therefore become more popular with exploits that will be able to abuse them. Other classes are not as common and are more unique to exploits, though valid software may use it as well, resulting in false detections.

Conclusion

Does this mean there are no more API-based KASLR bypasses? Or that all existing exploits will immediately get detected? Probably not. EDRs will take a while to start registering for these events and using them, especially since 23H2 will only be officially released some time next fall and it’ll probably be another year or two until most security products realize this event exists. And since this event is sent to the Threat Intelligence channel, which only PPLs can register for, many products can’t access this or other exploit-related events at all. Besides, even for the security products that will register for this event, this isn’t a world-changing addition. This ETW event simply replaces a few user-mode hooks that some EDRs were already using, without supplying entirely new capabilities. This event will enable EDRs to get information for some additional calls done by malicious processes, but that is only a single step in an exploit and will undoubtedly lead to many false positive if security products rely on it too heavily. And anyway, this event only covers some known indicators, leaving many others as potential bypasses

To summarize, this is a cool addition that I hope security products will use to add another layer of visibility into potential exploits. While it’s not a game changer just yet, it’s definitely something for both EDRs and exploit developers to consider in the near future.


Understanding a New Mitigation: Module Tampering Protection

A few months ago, I spoke at Paranoia conference about obscure and undocumented mitigations. Following the talk, a few people asked how I found out about these mitigations and how I figured out what they did and how they worked. So I thought I’d try to focus on one of those mitigations and show the full research process, as well as how the ideas behind it can be used for other purposes.

To do that I chose module tampering protection. I’ll start by explaining what it is and what it does for those of you who are only interested in the bottom line, and then show the whole process for those who would like to reproduce this work or learn some RE techniques.

TL;DR: What’s Module Tampering Protection?

Module tampering protection is a mitigation that protects against early modifications of the process main image, such as IAT hooking or process hollowing. It uses a total of three APIs: NtQueryVirtualMemory, NtQueryInformationProcess and NtMapViewOfSection. If enabled, the loader will check for changes in the main image headers and the IAT page before calling the entry point. It does that by calling NtQueryVirtualMemory with the information class MemoryWorkingSetExInformation. The returned structure contains information about the sharing status of the page, as well as whether it was modified from its original view. If the headers or the IAT have been modified from their original mappings (for example, if the main image has been unmapped and another image has been mapped in its place), the loader will call NtQueryInformationProcess with the class ProcessImageSection to get a handle to the main image section, and will then remap it using NtMapViewOfSection. From that point the new section will be used and the tampered copy of the image will be ignored.

This mitigation is available since RS3 and can be enabled on process creation using PROCESS_CREATION_MITIGATION_POLICY2_MODULE_TAMPERING_PROTECTION_MASK.

The Full Analysis

For those of you interested in the full path from knowing nothing about this mitigation to knowing everything about it, let’s start.

Discovering the Mitigation

One question I get occasionally is how people can even discover the existence of these types of mitigations when Microsoft never announces or documents them. So, one good place to look at would be the various MitigationFlags fields in the EPROCESS structure. There are currently three MitigationFlags fields (MitigationFlags, MitigationFlags2, MitigationsFlags3), each containing 32 bits. In the first two the whole 32 bits are already used, so MitigationFlags3 was recently added, and currently contains three mitigations, and I’m sure more will be added soon. These flags represent the enabled mitigations in the process. For example, we can use WinDbg to print EPROCESS.MitigationFlags for the current process:

dx @$curprocess.KernelObject.MitigationFlagsValues
@$curprocess.KernelObject.MitigationFlagsValues
    [+0x000 ( 0: 0)] ControlFlowGuardEnabled : 0x1 [Type: unsigned long]
    [+0x000 ( 1: 1)] ControlFlowGuardExportSuppressionEnabled : 0x0 [Type: unsigned long]
    [+0x000 ( 2: 2)] ControlFlowGuardStrict : 0x0 [Type: unsigned long]
    [+0x000 ( 3: 3)] DisallowStrippedImages : 0x0 [Type: unsigned long]
    [+0x000 ( 4: 4)] ForceRelocateImages : 0x0 [Type: unsigned long]
    [+0x000 ( 5: 5)] HighEntropyASLREnabled : 0x1 [Type: unsigned long]
    [+0x000 ( 6: 6)] StackRandomizationDisabled : 0x0 [Type: unsigned long]
    [+0x000 ( 7: 7)] ExtensionPointDisable : 0x0 [Type: unsigned long]
    [+0x000 ( 8: 8)] DisableDynamicCode : 0x0 [Type: unsigned long]
    [+0x000 ( 9: 9)] DisableDynamicCodeAllowOptOut : 0x0 [Type: unsigned long]
    [+0x000 (10:10)] DisableDynamicCodeAllowRemoteDowngrade : 0x0 [Type: unsigned long]
    [+0x000 (11:11)] AuditDisableDynamicCode : 0x0 [Type: unsigned long]
    [+0x000 (12:12)] DisallowWin32kSystemCalls : 0x0 [Type: unsigned long]
    [+0x000 (13:13)] AuditDisallowWin32kSystemCalls : 0x0 [Type: unsigned long]
    [+0x000 (14:14)] EnableFilteredWin32kAPIs : 0x0 [Type: unsigned long]
    [+0x000 (15:15)] AuditFilteredWin32kAPIs : 0x0 [Type: unsigned long]
    [+0x000 (16:16)] DisableNonSystemFonts : 0x0 [Type: unsigned long]
    [+0x000 (17:17)] AuditNonSystemFontLoading : 0x0 [Type: unsigned long]
    [+0x000 (18:18)] PreferSystem32Images : 0x0 [Type: unsigned long]
    [+0x000 (19:19)] ProhibitRemoteImageMap : 0x0 [Type: unsigned long]
    [+0x000 (20:20)] AuditProhibitRemoteImageMap : 0x0 [Type: unsigned long]
    [+0x000 (21:21)] ProhibitLowILImageMap : 0x0 [Type: unsigned long]
    [+0x000 (22:22)] AuditProhibitLowILImageMap : 0x0 [Type: unsigned long]
    [+0x000 (23:23)] SignatureMitigationOptIn : 0x0 [Type: unsigned long]
    [+0x000 (24:24)] AuditBlockNonMicrosoftBinaries : 0x0 [Type: unsigned long]
    [+0x000 (25:25)] AuditBlockNonMicrosoftBinariesAllowStore : 0x0 [Type: unsigned long]
    [+0x000 (26:26)] LoaderIntegrityContinuityEnabled : 0x0 [Type: unsigned long]
    [+0x000 (27:27)] AuditLoaderIntegrityContinuity : 0x0 [Type: unsigned long]
    [+0x000 (28:28)] EnableModuleTamperingProtection : 0x0 [Type: unsigned long]
    [+0x000 (29:29)] EnableModuleTamperingProtectionNoInherit : 0x0 [Type: unsigned long]
    [+0x000 (30:30)] RestrictIndirectBranchPrediction : 0x0 [Type: unsigned long]
    [+0x000 (31:31)] IsolateSecurityDomain : 0x0 [Type: unsigned long]

Towards the end, in bits 28 and 29, we can see the values EnableModuleTamperingProtection and EnableModuleTamperingProtectionNoInherit. Unfortunately, searching for these names doesn’t get any great results. There are a couple of websites that just show the structure with no explanation, one vague stack overflow answer that briefly mentions EnableModuleTamperingProtectionNoInherit with no added details, and this tweet:

Unsurprisingly, the most detailed explanation is a tweet from Alex Ionescu from 2017. This isn’t exactly full documentation, but it’s a start. If you already know and understand the concepts that make up this mitigation, this series of tweets is probably very clear and explains all there is to know about the feature. If you’re not familiar with the underlying concepts, this probably raises more questions than answers. But don’t worry, we’ll take it apart piece-by-piece.

Where Do We Look?

The first question to answer is: where is this mitigation implemented? Alex gives us some direction with the function names, but if he didn’t, or things changed since 2017 (or you choose not to believe him), where would you start?

The first place to start searching for the implementation of process mitigations is often the kernel: ntoskrnl.exe. However, this is a huge binary that’s not easy to search through. There are no function names that seem at all relevant to this mitigation, so there’s no obvious place to start.

Instead, you could try a different approach and try to find references to the MitigationFlags field of the EPROCESS with access to one of those two flags. But unless you have access to the Windows source code, there’s no easy way to do that. What you can do however, is take advantage of the fact that the EPROCESS is a large structure and that MitigationFlags exists towards the end of it, at offset 0x9D0. One very inelegant but effective way to go is to use the IDA search function and search for all references to 9D0h:

(Edit: instead of a text search, try an immediate search. It will run much faster while still getting all the relevant results)

This will be very slow because it’s a large binary, and some results will have nothing to do with the EPROCESS structure so you’d have to search through the results manually. Also, just finding references to the field is not enough – MitigationFlags contains 32 bits, and only two of them are relevant in the current context. So, you’d have to search through all the results for occurrences where:

  1. 0x9D0 is used as an offset into an EPROCESS structure – you’d have to use some intuition here since there is no guaranteed way to know the type of structure used by each case, though for larger offsets there are only a handful of options that could be relevant and it can mostly be guessed by the function name and context.
  2. The MitigationFlags field is being compared or set to either 0x10000000 (EnableModuleTamperingProtection) or 0x20000000 (EnableModuleTamperingProtectionNoInherit). Or bits 28 or 29 are tested or set by bit number through assembly instructions such as bt or bts.

After running the search, the results look something like this:

You can now walk through the results and get a feeling of what mitigations flags are used by the kernel and in which cases. And then I’ll let you know that this effort was completely useless since EnableModuleTamperingProtection is referenced at exactly one place in the kernel: PspApplyMitigationOptions, called when a new process is created:

So, the kernel keeps track of whether this mitigation is enabled, but never tests it. This means the mitigation itself is implemented elsewhere. This search might have been useless for this specific mitigation, but it’s one of several ways to find out where a mitigation is implemented and can be useful for other process mitigations, so I wanted to mention it even if it’s silly and unimpressive.

But back to module tampering protection – a second location where process mitigations are sometimes implemented is ntdll.dll, the first user-mode image to be loaded in every process. This DLL contains the loader, system call stubs, and many other basic components needed by all processes. It makes sense for this mitigation to be implemented here, since the name suggests it’s related to module loads, which happen through the loader in ntdll.dll. Additionally, this is the module that contains that functions Alex mentioned in his tweet.

Even if we didn’t have this tweet, just opening ntdll and searching for “tampering” quickly finds us exactly one result: the function LdrpCheckPagesForTampering. Looking for callers to this function we see that it’s called from a single place, LdrpGetImportDescriptorForSnap:

In the first line in the screenshot, we can see two checks: the first one validates that the current entry being processed is the main image, so the module being loaded in the main image module. The second check is for two bits in LdrSystemSllInitBlock.MitigationOptionsMap.Map[1]. We can see the exact field being checked here only because I applied the correct type to LdrSystemDllInitBlock – if you look at this function without applying the correct type, you’ll see some random, unnamed memory address being referenced instead. LdrSystemDllInitBlock is a data structure containing all the global information needed by the loader, such as the process mitigation options. It’s undocumented but has the type PS_SYSTEM_DLL_INIT_BLOCK that is available in the symbols so we can use it here (notice that this structure isn’t available in the NTDLL symbols, rather you’d find it in the symbols of ole32.dll and combase.dll). The MitigationOptionsMap field is just an array of three ULONG64s containing bits that mark the mitigation options that are set for this process. We can find the value for all the mitigation flags in WinBase.h. Here are the values for module tampering protection:

//
// Define the module tampering mitigation policy options.
//

#define PROCESS_CREATION_MITIGATION_POLICY2_MODULE_TAMPERING_PROTECTION_MASK       (0x00000003ui64 << 12)
#define PROCESS_CREATION_MITIGATION_POLICY2_MODULE_TAMPERING_PROTECTION_DEFER      (0x00000000ui64 << 12)
#define PROCESS_CREATION_MITIGATION_POLICY2_MODULE_TAMPERING_PROTECTION_ALWAYS_ON  (0x00000001ui64 << 12)
#define PROCESS_CREATION_MITIGATION_POLICY2_MODULE_TAMPERING_PROTECTION_ALWAYS_OFF (0x00000002ui64 << 12)
#define PROCESS_CREATION_MITIGATION_POLICY2_MODULE_TAMPERING_PROTECTION_NOINHERIT  (0x00000003ui64 << 12)

These values are relative to the top DWORD of Map[1], so the module tampering protection bit is actually at bit 44 of Map[1] – the same one being checked in the Hex Rays screenshot (and in PspApplyMitigationOptions, shown earlier).

Now we know where this mitigation is applied the checked, so we can start looking at the implementation and understand what this mitigation does.

Implementation Details

Looking again at LdrpGetImportDescriptorForSnap: after the two checks that we already saw, the function fetches the NT headers for the main image and calls LdrpCheckPagesForTampering twice. The first time, the address being sent is imageNtHeaders->OptionalHeader.DataDirectory[IMAGE_DIRECTORY_ENTRY_IMPORT] – the image’s import table – and a size of 8 bytes. The second time, the function is called with the address and size of the NT headers themselves. If one of these pages is deemed to be tampered, LdrpMapCleanModuleView gets called to (judging by the name) map a clean view of the main image module.

Let’s look inside LdrpCheckPagesForTampering to see how NTDLL decides if a page is tampered:

First, this function calculates the number of pages within the requested range of bytes (in both cases we’ve seen here, that number is 1). Then it allocates memory and calls ZwQueryVirtualMemory with MemoryInformationClass == 4 (MemoryWorkingSetExInformation). This system call and information class are ones security people might not see very often – the working set is a way to manage and prioritize physical memory pages based on their current status, so not often interesting for most security people. However, the working set does carry some attributes that could interest us. Specifically, the “shared” flags.

I won’t go into the detail of mapped and shared memory here, since they’re explained in plenty of other places. But in short, the system tries to not duplicate memory, as that would mean physical memory would quickly fill up with duplicated pages, mostly those belonging to images and DLLs – system DLLs like ntdll.dll or kernel32.dll are mapped in most (if not all) of the processes in the system, so having a separate copy in physical memory for each process would simply be wasteful. So, these image pages are shared between all processes. That is, unless the images are modified in any way. Image pages use a special protection called Copy On Write, which allows the pages to be writeable, but will create a fresh copy in physical memory if the page is written into. This means any changes done to a local mapping of a DLL (for example, the writing of user-mode hooks, or any data changes), will only affect the DLL in the current process.

These settings are saved as flags that can be queried through NtQueryVirtualMemory, with the information class used here: MemoryWorkingSetExInformation. It’ll return data about the queried pages in a MEMORY_WORKING_SET_EX_INFORMATION structure:

typedef struct _MEMORY_WORKING_SET_EX_BLOCK
{
    union
    {
        struct
        {
            ULONG64 Valid : 1;
            ULONG64 ShareCount : 3;
            ULONG64 Win32Protection : 11;
            ULONG64 Shared : 1;
            ULONG64 Node : 6;
            ULONG64 Locked : 1;
            ULONG64 LargePage : 1;
            ULONG64 Priority : 3;
            ULONG64 Reserved : 3;
            ULONG64 SharedOriginal : 1;
            ULONG64 Bad : 1;
            ULONG64 Win32GraphicsProtection : 4;
            ULONG64 ReservedUlong : 28;
        };
        struct
        {
            struct
            {
                ULONG64 Valid : 1;
                ULONG64 Reserved0 : 14;
                ULONG64 Shared : 1;
                ULONG64 Reserved1 : 5;
                ULONG64 PageTable : 1;
                ULONG64 Location : 2;
                ULONG64 Priority : 3;
                ULONG64 ModifiedList : 1;
                ULONG64 Reserved2 : 2;
                ULONG64 SharedOriginal : 1;
                ULONG64 Bad : 1;
                ULONG64 ReservedUlong : 32;
            };
        } Invalid;
    };
} MEMORY_WORKING_SET_EX_BLOCK, *PMEMORY_WORKING_SET_EX_BLOCK;

typedef struct _MEMORY_WORKING_SET_EX_INFORMATION
{
    PVOID VirtualAddress;
    union
    {
        union
        {
            MEMORY_WORKING_SET_EX_BLOCK VirtualAttributes;
            ULONG64 Long;
        };
    } u1;
} MEMORY_WORKING_SET_EX_INFORMATION, *PMEMORY_WORKING_SET_EX_INFORMATION;

This structure give you the virtual address that’s been queried, and bits containing information about the state of the page, such as: its validity, protection, is it a parge page, and its sharing status. There are a few different bits related to the sharing status of a page:

  1. Shared – is the page shareable? That doesn’t necessarily mean that the page is currently shared with any other processes, but, for example, private memory will not be shared unless specifically requested by the process.
  2. ShareCount – this field tells you how many mappings exist for this page. For a page not currently shared with any other process, this will be 1. For pages shared with other processes, this will normally be higher.
  3. SharedOriginal – this flag indicates whether this is the original mapping of this page. So, if a page was modified, which led to creating a fresh copy in physical memory, this will be set to zero as this isn’t the original mapping of the page.

This SharedOriginal bit is the one checked by LdrpCheckPagesForTampering to tell if this page is the original copy or a fresh copy created due to changes. If this isn’t the original copy, this means that the page was tampered with in some way so the function will return TRUE. LdrpCheckPagesForTampering runs this check for every page that’s being queried and will return TRUE if any of them have been tampered with.

If the function returned TRUE for any of the checked ranges, LdrpMapCleanModuleView gets called:

This function is short and simple: it calls NtQueryInformationProcess with InformationClass == 89 (ProcessImageSection) to fetch the section handle for the main image, then re-maps it using NtMapViewOfSection and closes the handle. It writes the address of the new section to DataTableEntry->SwitchBackContect, to be used instead of the original tampered mapping.

Why does this feature choose to check specifically these two ranges for tampering – the import table and the NT headers?

That’s because these are two places that will often be targeted by an attacker trying to hollow the process. If the main image is unmapped and replaced by a malicious image, the NT headers will be different and be considered tampered. Process hollowing can also tamper with the import table, to point to different functions than the ones the process expects. So, this is mostly an anti-hollowing feature, targeted to spotting tampering attempts in the main image, and replacing it with a fresh copy of the image that hasn’t been tampered with.

Limitations

Unfortunately, this feature is relatively limited. You can enable or disable it, and that’s about it. The functions implementing the mitigation are internal and can’t be called externally. So, for example, extending the mitigation to other modules is not possible unless you write the code for it yourself (and map the modules manually, since the section handles for those isn’t conveniently stored anywhere). Additionally, this mitigation contains no logging or ETW events. When the mitigation notices tampering in the main image it’ll silently map and use a new copy and leave no trace for security products or teams to find. The only hint will be that NtMapViewOfSection will be called again for the main image and generate an ETW event and kernel callback. But this is likely to go unnoticed as it doesn’t necessarily mean something bad happened and will probably not lead to any alerts or significant investigation of what might be a real attack.

On the bright side, this mitigation is extremely simple and useful, and very easily to mimic if you want to implement it for other use cases, such as detecting hooks placed on your process and mapping a fresh, unhooked copy of the page to use. You can do that instead of using direct system calls!

Who Uses This?

Running a query in WinDbg, I find no results for any process enabling module tampering protection. After a bit of probing around I managed to find only one process that enables this: SystemSettingsAdminFlows.exe. This process is executed when you open Apps->Optional Features in the Windows Settings menu. I don’t know why this specific process uses this mitigation or why it’s the only one that does, but this is the only one I managed to find so far that enables module tampering protection.

Conclusion

I tried to use this post to show a bit more of the work involved in analyzing an unknown feature and demonstrating some of the steps I take to scope and learn about a new piece of code. I hope this has been helpful and gave some of you useful tips in how to approach a new research topic!

One I/O Ring to Rule Them All: A Full Read/Write Exploit Primitive on Windows 11

This blog post will cover the post-exploitation technique I presented at TyphoonCon 2022. For anyone interested in the talk itself, I’ll link the recording here when it becomes available.
This technique is a post exploitation primitive unique to Windows 11 22H2+ – there are no 0-days here. Instead, there’s a method to turn an arbitrary write, or even arbitrary increment bug in the Windows kernel into a full read/write of kernel memory.

Background

Kernel exploitation (and exploitation in general) on Windows is becoming harder with every new version. Driver Signature Enforcement made it harder for an attacker to load unsigned drivers, and later HVCI made it entirely impossible – with the added difficulty of a driver block list, preventing attackers from loading signed vulnerable drivers. SMEP and KCFG mitigate against code redirection through function pointer overwrites, and KCET makes ROP impossible as well. Other VBS features such as KDP protect kernel data, so common targets such as g_CiOptions can no longer be modified by an attacker. And on top of those, there are Patch Guard and Secure Kernel Patch Guard which validate the integrity of the kernel and many of its components.

With all the existing mitigations, just finding a user->kernel bug no longer guarantees successful exploitation. In Windows 11 with all mitigations enabled, it’s nearly impossible to achieve Ring 0 code execution. However, data-based attacks are still a viable solution

 A known technique for a data-only attack is to create a fake kernel-mode structure in user mode, then tricking the kernel to use it through a write-what-where bug (or any other bug type that can achieve that). The kernel will treat this structure like valid kernel data, allowing the attacker to achieve privilege escalation by manipulating the data in the structure, thus manipulating kernel actions that are done based on that data. There are numerous examples for this technique, which was used in different ways. For example, this blog post by J00ru demonstrates using a fake token table to turn an off-by-one bug into an arbitrary write, and later using that to run shellcode in ring 0. Many other examples take advantage of different Win32k objects to achieve arbitrary read, write or both. Some of these techniques have already been mitigated by Microsoft, other are already known and hunted for by security products, and others are still usable and most likely used in the wild.

In this post I’d like to add one more technique to the pile – using I/O ring preregistered buffers to create a read/write primitive, using 1-2 arbitrary kernel writes (or increments). This technique uses a new object type that currently has very limited visibility to security products and is likely to be ignored for a while. The method is very simple to use – once you understand the underlying mechanism of I/O ring.

I/O Ring

I already wrote several blog posts (and a talk) about I/O rings so I’ll just present the basic idea and the parts relevant to this technique. Anyone interested in learning more about it can read the previous posts on the topic or watch the talk from P99 Conf.

In short, I/O ring is a new asynchronous I/O mechanism that allows an application to queue as many as 0x10000 I/O operations and submit them all at once, using a single API call. The mechanism was modeled after the Linux io_uring, so the design of the two is very similar. For now, I/O rings don’t support every possible I/O operation yet. The available operations in Windows 11 22H2 are read, write, flush and cancel. The requested operations are written into a Submission Queue, and then submitted all together. The kernel processes the requests and writes the status codes into a Completion Queue – both queues are in a shared memory region accessible to both user mode and kernel mode, allowing sharing of data without the overhead of multiple system calls.

In addition to the available I/O operations, the application can queue two more types of operations unique to I/O ring: preregister buffers and preregister files. These options allow an application to open all the file handles or create all the input/output buffers ahead of time, register them and later reference them by index in I/O operations queued through the I/O ring. When the kernel processes an entry that uses a preregistered file handle or buffer, it fetches the requested handle/buffer from the preregistered array and passes it on to the I/O manager where it is handled normally.

For the visual learners, here’s an example of a queue entry using a preregistered file handle and buffer:

A submission queue that’s ready to be submitted to the kernel could look something like this:

The exploitation technique discussed here takes advantage of the preregistered buffers array, so let’s go into a bit more detail there:

Registered Buffers

As I mentioned, one of the operations an application can do is allocate all the buffers for its future I/O operations, then register them with the I/O ring. The preregistered buffers are referenced through the I/O ring object:

typedef struct _IORING_OBJECT
{
    USHORT Type;
    USHORT Size;
    NT_IORING_INFO UserInfo;
    PVOID Section;
    PNT_IORING_SUBMISSION_QUEUE SubmissionQueue;
    PMDL CompletionQueueMdl;
    PNT_IORING_COMPLETION_QUEUE CompletionQueue;
    ULONG64 ViewSize;
    ULONG InSubmit;
    ULONG64 CompletionLock;
    ULONG64 SubmitCount;
    ULONG64 CompletionCount;
    ULONG64 CompletionWaitUntil;
    KEVENT CompletionEvent;
    UCHAR SignalCompletionEvent;
    PKEVENT CompletionUserEvent;
    ULONG RegBuffersCount;
    PVOID RegBuffers;
    ULONG RegFilesCount;
    PVOID* RegFiles;
} IORING_OBJECT, *PIORING_OBJECT;

When the request gets processed, the following things happen:

  1. IoRing->RegBuffers and IoRing->RegBuffersCount get set to zero.
  2. The kernel validates that Sqe->RegisterBuffers.Buffers and Sqe->RegisterBuffers.Count are both not zero.
  3. If the request came from user mode, the array is probed to validate that it’s fully in the user mode address space. Array size can be up to sizeof(ULONG).
  4. If the ring previously had a preregistered buffers array and the size of the new buffer is the same as the size of the old buffer, the old buffer array is placed back in the ring and the new buffer is ignored.
  5. If the previous checks pass and the new buffer array is to be used, a new paged pool allocation is made – this will be used to copy the data from the user mode array and will be pointed to by IoRing->RegBuffers.
  6. If there’s previously been a registered buffers array pointed to by the I/O ring, it gets copied into the new kernel array. Any new buffers will be added in the same allocation, after the old buffers.
  7. Every entry in the array sent from user mode is probed to validate that the requested buffer is fully in user mode, then gets copied to the kernel array.
  8. The old kernel array (if one existed) is freed, and the operation is completed.

This whole process is safe – the data is only read from user mode once, probed and validated correctly to avoid overflows and accidental reads or writes of kernel addresses. Any future use of these buffers will fetch them from the kernel buffer.

But what if we already have an arbitrary kernel write bug?

In that case, we can overwrite a single pointer – IoRing->RegBuffers, to point it to a fake buffer that is fully under our control. We can populate it with kernel mode addresses and use those as buffers in I/O operations. When the buffers are referenced by index they don’t get probed – the kernel assumes that if the buffers were safe when they where registered, then copied to a kernel allocation, they would still be safe when they’re referenced as part of an operation.

This means that with a single arbitrary write and a fake buffer array we can get full control of the kernel address space through read and write operations.

The Primitive

Once IoRing->RegBuffers points to the fake, user controlled array, we can use normal I/O ring operations to generate kernel reads and writes into whichever addresses we want by specifying an index into our fake array to use as a buffer:

  1. Read operation + kernel address: The kernel will “read” from a file of our choice into the specified kernel address, leading to arbitrary write.
  2. Write operation + kernel address: The kernel will “write” the data in the specified address into a file of our choice, leading to arbitrary read.

Initially my primitive relied on files to read and write to, but Alex suggested the use of named pipes instead which is way cooler and a lot less visible, leaving no traces on disk. So, the rest of the post + the exploit code will be using named pipes.

As you can see, technique itself is pretty simple. So simple, in fact, it doesn’t even require the use of any (well, almost) undocumented APIs or secret data structures. It uses Win32 API and structures that are available in the public symbols of ntoskrnl.exe. The exploit primitive involves the following steps:

  1. Create two named pipes with CreateNamedPipe: one will be used for input for arbitrary kernel writes and the other for output for arbitrary kernel reads. At least the pipe that’ll be used as input should be created with flag PIPE_ACCESS_DUPLEX to allow both reading and writing. I chose to create both with PIPE_ACCESS_DUPLEX for convenience.
  2. Open client handles for both pipes with CreateFile, both with read and write permissions.
  3. Create an I/O ring: this can be done through CreateIoRing API.
  4. Allocate a fake buffers array in the heap: Starting from the official 22H2 release, the registered buffers array is no longer a flat array, but an array of IOP_MC_BUFFER_ENTRY structures, so this gets slightly more tricky.
  5. Find the address of the newly created I/O ring object: since I/O rings use a new object type, IORING_OBJECT, we can leak its address through a well-known KASLR bypass technique. NtQuerySystemInformation with SystemHandleInformation leaks the kernel addresses of objects, including our new I/O ring object. Fortunately, the internal structure of IORING_OBJECT is in the public symbols so there’s no need to reverse engineer the structure to find the offset of RegBuffers. We add the two together to get the target for our arbitrary write.
    Unfortunately, this API as well as many other KASLR bypasses can only be used by processes with Medium IL or higher, so Low IL processes, sandboxed processes and browsers can’t use it and will have to find a different method.
  6. Use your preferred arbitrary write bug to overwrite IoRing->RegBuffers with the address of the fake user-mode array. Notice that if you haven’t previously registered a valid buffers array you’ll also have to overwrite IoRing->RegBuffersCount to have a non-zero value.
  7. Populate the fake buffers array with kernel pointers to read or write to: to do this you might need other KASLR bypasses in order to find your target addresses. You could use NtQuerySystemInformation with SystemModuleInformation class to find the base addresses of kernel modules, use the same technique as earlier to find kernel addresses of objects, or use the pointers available inside the I/O ring itself, which point to data structures in the paged pool.
  8. Queue read and write operations in the I/O ring through BuildIoRingReadFile and BuildIoRingWriteFile.

With this method, arbitrary reads and writes aren’t limited to a pointer size, like many other methods, but can be as large as sizeof(ULONG), reading or writing many pages of kernel data simultaneously.

Cleanup

This technique requires minimal cleanup: all that’s required it to set IoRing->RegBuffers to zero before closing the handle to the I/O ring object. As long as the pointer is zero, the kernel won’t try to free anything even if IoRing->RegBuffersCount is non-zero.

Cleanup gets slightly more complicated if you choose to first register a valid buffer array and then overwrite the existing pointer in the I/O ring object – in that case there is already an allocated kernel buffer, which also adds a reference count in the EPROCESS object. In that case, the EPROCESS RefCount will need to be decremented before the process exits to avoid leaving a stale process around. Luckily that is easy to do with one more arbitrary read + write using our existing technique.

Arbitrary Increment

A couple years ago I published a series of blogs discussing CVE-2020-1034 – an arbitrary increment vulnerability in EtwpNotifyGuid. Back then, I focused on the challenges of exploiting this bug and used it to increment the process’ token privileges – a very well known privilege escalation technique. This method works, though it’s possible to detect in real time or retroactively using different tools. Security vendors are well aware of this technique and many already detect it.

That project made me interested in other ways to exploit that specific bug class – an arbitrary increment of a kernel address, so I was very happy to find a post exploitation technique that finally fit. With the method I presented here, you can use an arbitrary increment to increment IoRing->RegBuffers from 0 to a user-mode address such as 0x1000000 (no need for 0x1000000 increments, just increment the 3rd byte by one) and increment IoRing->RegBuffersCount from 0 to 1 or 0x100 (or more). This does require you to trigger the bug twice in order to create the technique, but I recommend doing that anyway to avoid the extra cleanup required when overwriting an existing pointer.

Forensics and Detection

This post exploitation technique has very little visibility and leaves few forensic traces: I/O rings have nearly no visibility through ETW except on creation, and the technique leaves no forensic traces in memory. The only part of this technique that is  visible to security products are the named pipes operations, visible to security products who use a filesystem filter driver (and most do). However, these pipes are local and aren’t used for anything that looks too suspicious — they read and write small amounts of data with no specific format, so they’re not likely to be flagged as suspicious

Portable Features = Portable Exploits?

I/O rings on Windows were modeled after the Linux io_uring and share many of the same features, and this one is no different. The Linux io_uring also allows registering buffers or file handles, and the registered buffers are handled very similarly and stored in the user_bufs field of the ring. This means that the same exploitation technique should also work on Linux (though I haven’t personally tested it).

The main difference between the two systems in this case is mitigation: while on Windows it’s difficult to mitigate against this technique, Linux has a mitigation that makes blocking this technique (at least in its current form) trivial: SMAP. This mitigation prevents access to user-mode addresses with kernel-mode privileges, blocking any exploitation technique that involves faking a kernel structure in user-mode. Unfortunately due to the basic design of the Windows system it’s unlikely SMAP will ever be a usable mitigation there, but it’s been available and used on Linux since 2012.

Of course there are still ways to bypass SMAP, such as shaping a kernel pool allocation to be used as the fake buffers array instead of a user-mode address or editing the PTE of the user-mode page that contains the fake array, but the basic exploitation primitive won’t work on systems that support SMAP.

22H2 Changes

The official 22H2 release introduced a change that affects this technique, but only slightly. Since Windows 11 build 22610 (so a couple of builds before the official 22H2 release) the buffer array in the kernel is no longer a flat array of addresses and lengths, but instead an array of pointers to a new data structure: IOP_MC_BUFFER_ENTRY:

typedef struct _IOP_MC_BUFFER_ENTRY
{
    USHORT Type;
    USHORT Reserved;
    ULONG Size;
    ULONG ReferenceCount;
    ULONG Flags;
    LIST_ENTRY GlobalDataLink;
    PVOID Address;
    ULONG Length;
    CHAR AccessMode;
    ULONG MdlRef;
    PMDL Mdl;
    KEVENT MdlRundownEvent;
    PULONG64 PfnArray;
    IOP_MC_BE_PAGE_NODE PageNodes[1];
} IOP_MC_BUFFER_ENTRY, *PIOP_MC_BUFFER_ENTRY;

This data structure is used as part of the MDL cache capability that was added in the same build. It looks complex and scary, but in our use-case most of these fields are never used and can be ignored. We still have the same Address and Length fields that we need for our technique to work, and to be compatible with the requirements of the new feature we also need to hardcode a few values in the fields Type, Size, AccessMode and ReferenceCount.

To adapt our technique to this new addition, here are the changes needed in our code:

  1. Allocate a fake buffers array, sized sizeof(PVOID) * NumberOfEntries.
  2. Allocate a IOP_MC_BUFFER_ENTRY structure for each fake buffer and place the pointer into the fake buffers array. Zero out the structure, then set the following fields:

    mcBufferEntry->Address = TargetAddress;
    mcBufferEntry->Length = Length;
    mcBufferEntry->Type = 0xc02;
    mcBufferEntry->Size = 0x80; // 0x20 * (numberOfPagesInBuffer + 3)
    mcBufferEntry->AccessMode = 1;
    mcBufferEntry->ReferenceCount = 1;

The PoC

I uploaded my PoC here. It works starting 22H2 preview builds (minimal supported version – before this build I/O rings didn’t yet support write operations) and up to the latest Windows Preview build (25415 as of today). For my arbitrary write/increment bugs I used the HEVD driver, recompiled to support arbitrary increments. The PoC supports both options, but if you use the latest HEVD release only the arbitrary write option will work.

For the arbitrary read target, I used a page from the ntoskrnl.exe data section – the offset of the section is hardcoded due to laziness, so it might break spontaneously when that offset changes.

One Year to I/O Ring: What Changed?

It’s been just over a year since the first version of I/O ring was introduced into Windows. The initial version was introduced in Windows 21H2 and I did my best to document it here, with a comparison to the Linux io_uring here. Microsoft also documented the Win32 functions. Since that initial version this feature progressed and received pretty significant changes and updates, so it deserves a follow-up post documenting all of them and explaining them in more detail.

New Supported Operations

Looking at the changes, the first and most obvious thing we can see is that two new operations are now supported – write and flush:

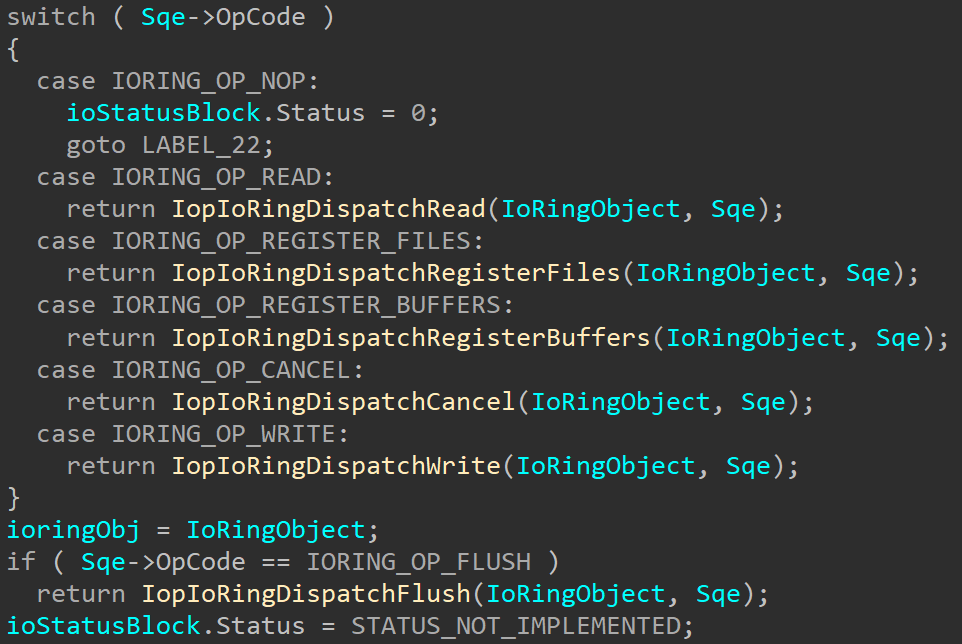
These allow using the I/O ring to perform write and flush operations. These new operations are processed and handled similarly to the read operation that’s been supported since the first version of I/O rings and forwarded to the appropriate I/O functions. New wrapper functions were added to KernelBase.dll to queue requests for these operations: BuildIoRingWriteFile and BuildIoRingFlushFile, and their definitions can be found in the ioringapi.h header file (available in the preview SDK):

STDAPI
BuildIoRingWriteFile (
    _In_ HIORING ioRing,
    IORING_HANDLE_REF fileRef,
    IORING_BUFFER_REF bufferRef,
    UINT32 numberOfBytesToWrite,
    UINT64 fileOffset,
    FILE_WRITE_FLAGS writeFlags,
    UINT_PTR userData,
    IORING_SQE_FLAGS sqeFlags
);

STDAPI
BuildIoRingFlushFile (
    _In_ HIORING ioRing,
    IORING_HANDLE_REF fileRef,
    FILE_FLUSH_MODE flushMode,
    UINT_PTR userData,
    IORING_SQE_FLAGS sqeFlags
);

Similarly to BuildIoRingReadFile, both of these build the submission queue entry with the requested OpCode and add it to the submission queue. Obviously, there are different flags and options needed for the new operations, such as the flushMode for flush operations or writeFlags for writes. To handle that, the NT_IORING_SQE structure now contains a union for the input data that gets interpreted according to the requested OpCode – the new structure is available in the public symbols and also at the end of this post.

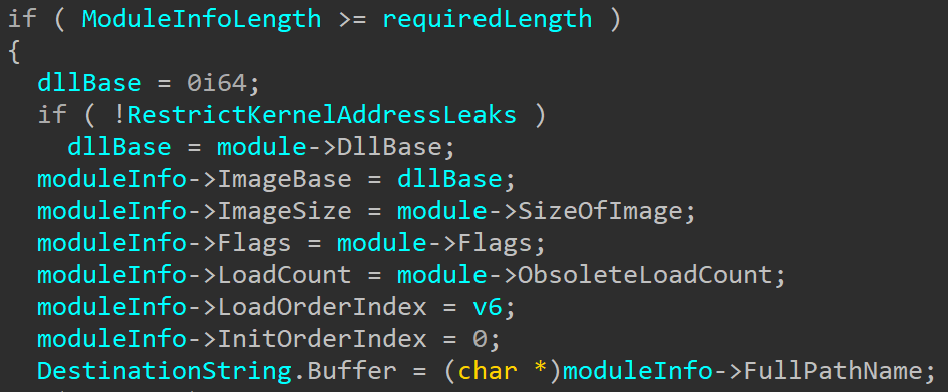
One small kernel change that was added to support write operations can be seen in IopIoRingReferenceFileObject:

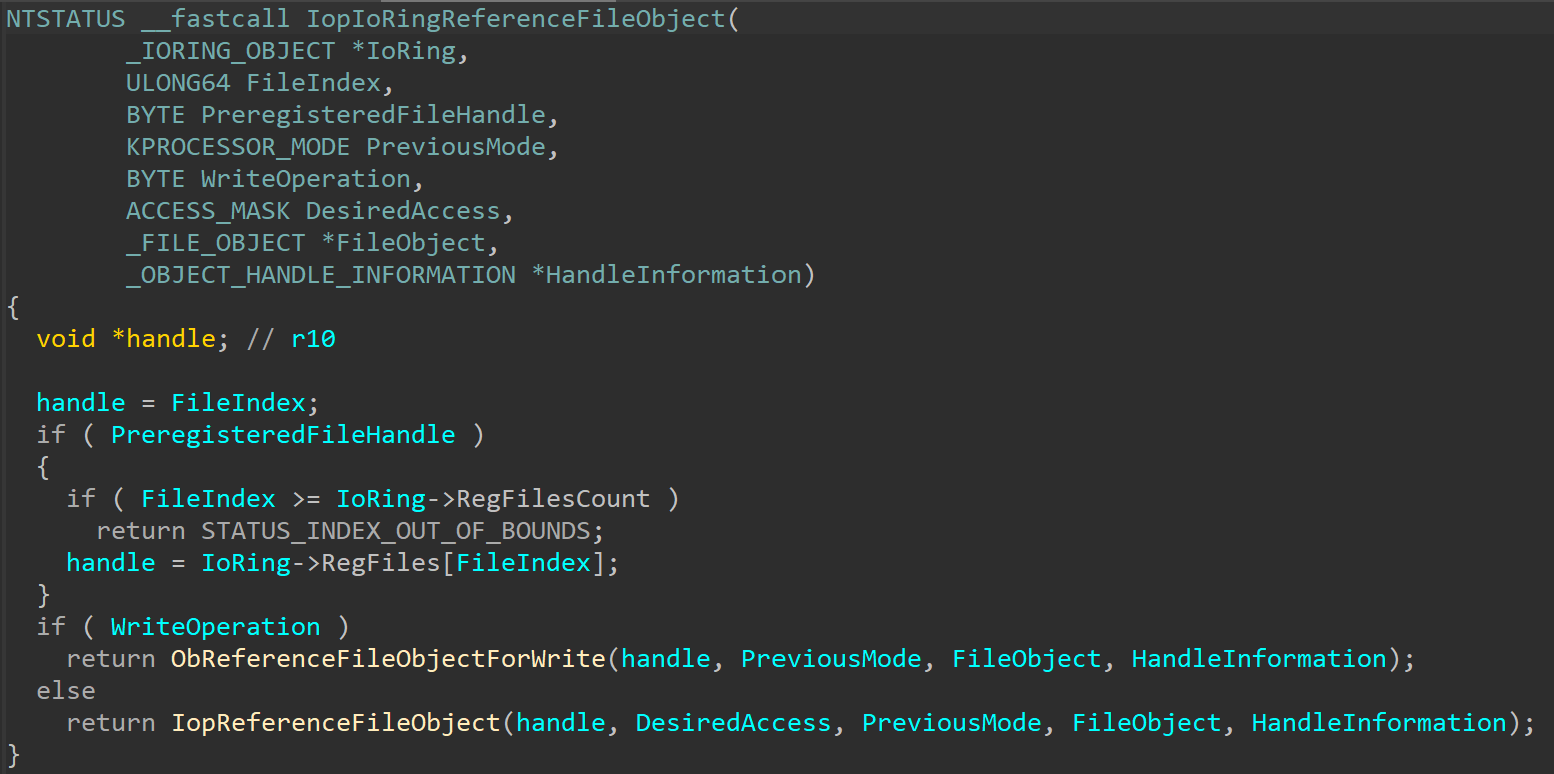
There are a few new arguments and an additional call to ObReferenceFileObjectForWrite. Probing of different buffers across the various functions also changed depending on the operations type.

User Completion Event

Another interesting change that was introduced as well is the ability to register a user event to be notified for every new completed operation. Unlike the I/O Ring’s CompletionEvent, that only gets signaled when all operations are complete, the new optional user event will be signaled for every newly completed operation, allowing the application to process the results as they are being written to the completion queue.

To support this new functionality, another system call was created: NtSetInformationIoRing:

NTSTATUS
NtSetInformationIoRing (
    HANDLE IoRingHandle,
    ULONG IoRingInformationClass,
    ULONG InformationLength,
    PVOID Information
);

Like other NtSetInformation* routines, this function receives a handle to the IoRing object, an  information class, length and data. Only one information class is currently valid: 1. The IORING_INFORMATION_CLASS structure is unfortunately not in the public symbols so we can’t know what it’s official name is, but I’ll call it IoRingRegisterUserCompletionEventClass. Even though only one class is currently supported, there might be other information classes supported in the future. One interesting thing here is that the function uses a global array IopIoRingSetOperationLength to retrieve the expected information length for each information class:

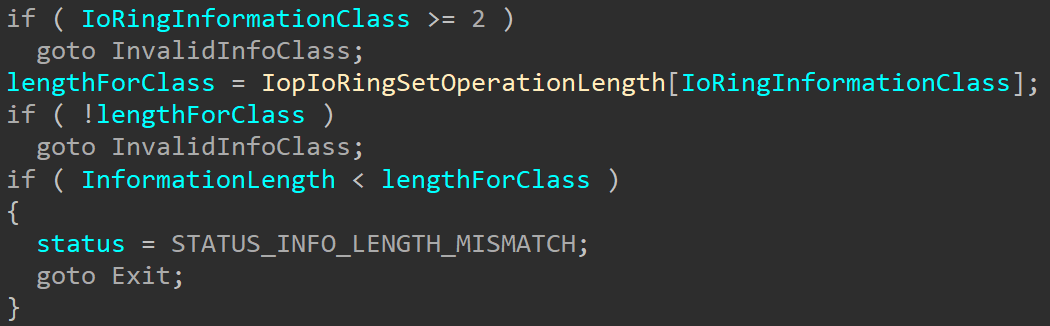
The array currently only has two entries: 0, which isn’t actually a valid class and returns a length of 0, and entry 1 which returns an expected size of 8. This length matches the function’s expectation to receive an event handle (HANDLEs are 8 bytes on x64). This could be a hint that more information classes are planned in the future, or just a different coding choice.

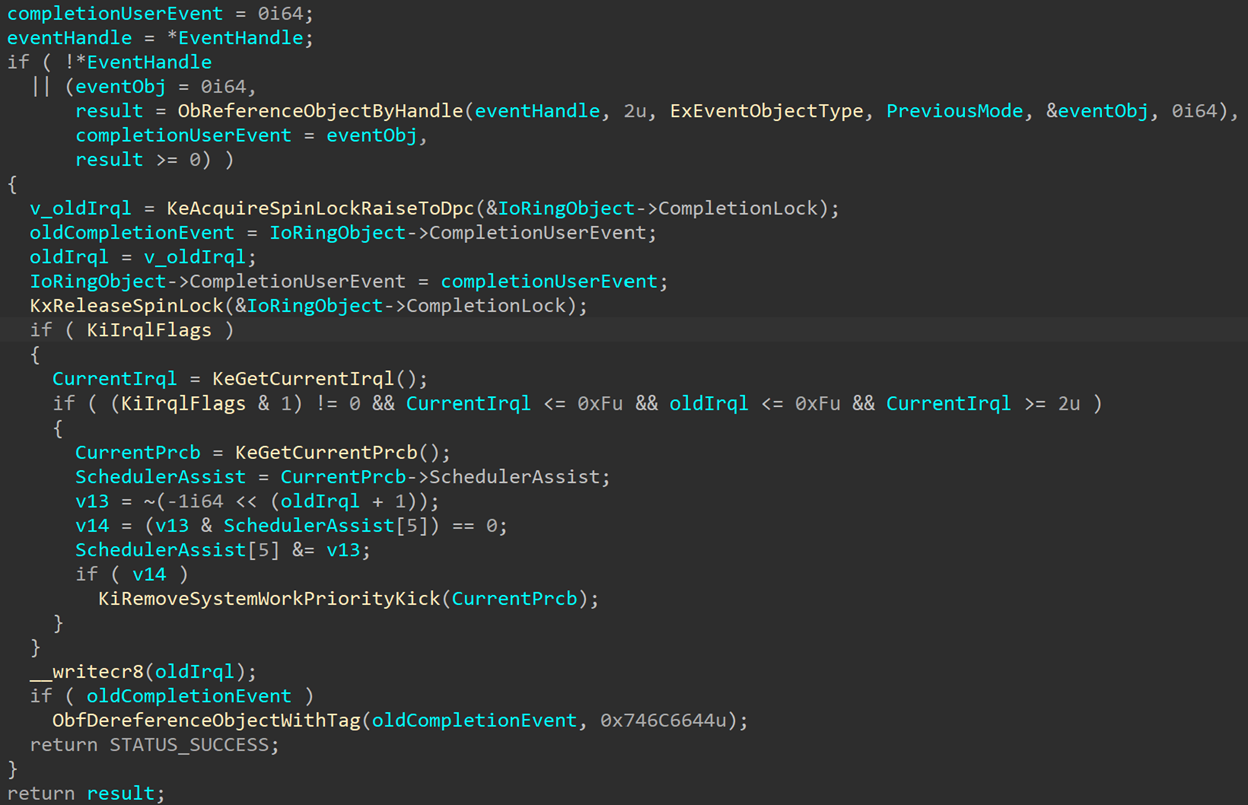
After the necessary input checks, the function references the I/O ring whose handle was sent to the function. Then, if the information class is IoRingRegisterUserCompletionEventClass, calls IopIoRingUpdateCompletionUserEvent with the supplied event handle. IopIoRingUpdateCompletionUserEvent will reference the event and place the pointer in IoRingObject->CompletionUserEvent. If no event handle is supplied, the CompletionUserEvent field is cleared:

The RE Corner

On a side note, this function might look rather large and mildly threatening, but most of it is simply synchronization code to guarantee that only one thread can edit the CompletionUserEvent field of the I/O ring at any point and prevent race conditions. And in fact, the compiler makes the function look larger than it actually is since it unpacks macros, so if we try to reconstruct the source code this function would look much cleaner:

NTSTATUS
IopIoRingUpdateCompletionUserEvent (
    PIORING_OBJECT IoRingObject,
    PHANDLE EventHandle,
    KPROCESSOR_MODE PreviousMode
    )
{
    PKEVENT completionUserEvent;
    HANDLE eventHandle;
    NTSTATUS status;
    PKEVENT oldCompletionEvent;
    PKEVENT eventObj;

    completionUserEvent = 0;
    eventHandle = *EventHandle;
    if (!eventHandle ||
        (eventObj = 0,
        status = ObReferenceObjectByHandle(
                 eventHandle, PAGE_READONLY, ExEventObjectType, PreviousMode, &eventObj, 0),
        completionUserEvent = eventObj,
        !NT_SUCCESS(status))
    {
        KeAcquireSpinLockRaiseToDpc(&IoRingObject->CompletionLock);
        oldCompletionEvent = IoRingObject->CompletionUserEvent;
        IoRingObject->CompletionUserEvent = completionUserEvent;
        KeReleaseSpinLock(&IoRingObject->CompletionLock);
        if (oldCompletionEvent)
        {
            ObDereferenceObjectWithTag(oldCompletionEvent, 'tlfD');
        }
        return STATUS_SUCCESS;
    }
    return status;
}

That’s it, around six lines of actual code. But, that is not the point of this post, so let’s get back to the topic at hand: the new CompletionUserEvent.

Back to the User Completion Event

The next time we run into CompletionUserEvent is when an IoRing entry is completed, in IopCompleteIoRingEntry:

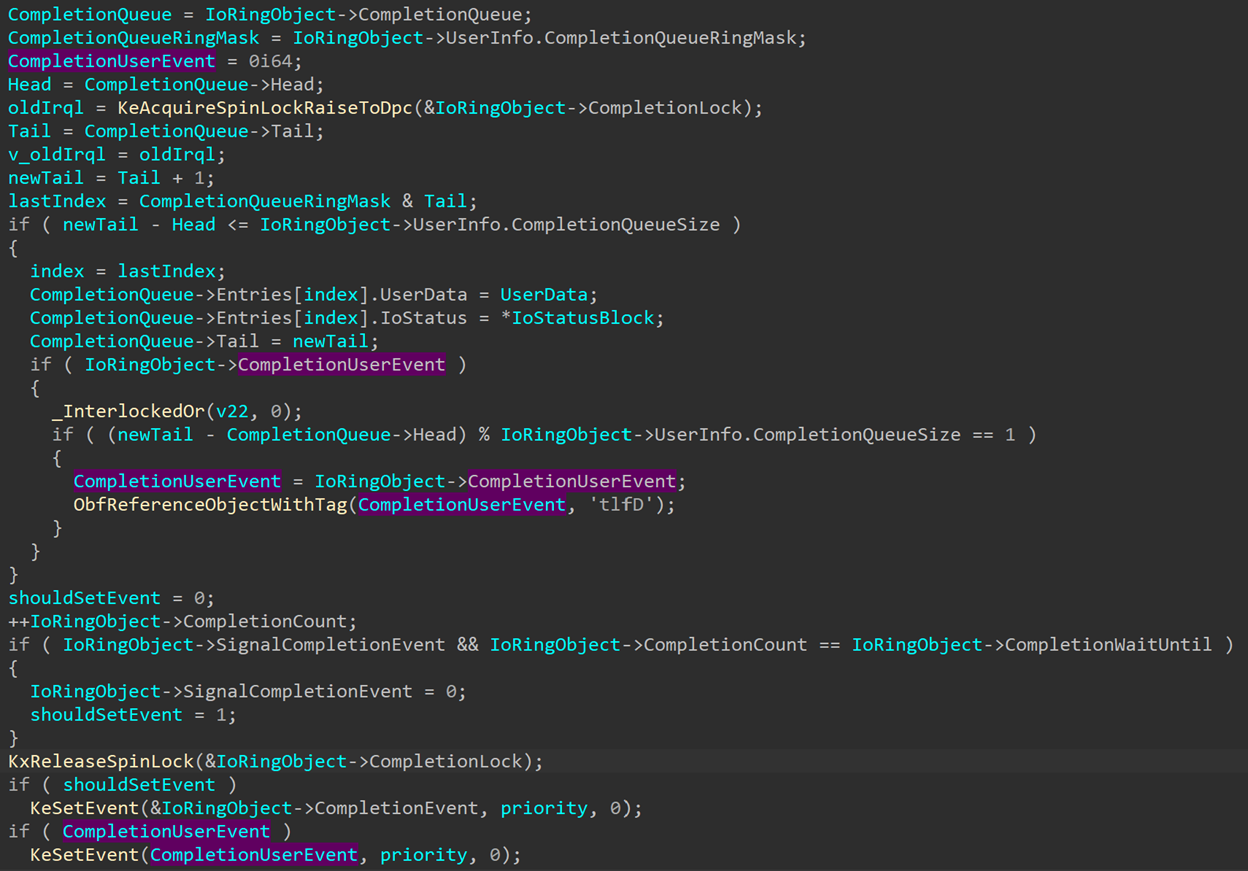
While the normal I/O ring completion event is only signaled once all operations are complete, the CompletionUserEvent is signaled under different conditions. Looking at the code, we see the following check:

Every time an I/O ring operation is complete and written into the completion queue, the CompletionQueue->Tail field gets incremented by one (referenced here as newTail). The CompletionQueue->Head field contains the index of the last completion entry that was written, and gets incremented every time the application processes another entry (If you use PopIoRingCompletion it’ll do that internally, otherwise you need to increment it yourself). So, (newTail - Head) % CompletionQueueSize calculates the number of completed entries that have not yet been processed by the application. If that amount is one, that means that the application has processed all completed entries except the latest one, that is being completed now. In that case, the function will reference the CompletionUserEvent and then call KeSetEvent to signal it.

This behavior allows the application to follow along with the completion of all its submitted operations by creating a thread whise purpose is to wait on the user event and process every newly completed entry just as it’s completed. This makes sure that the Head and Tail of the completion queue are always the same, so the next entry to be completed will signal the event, the entry will process the entry, and so on. This way the main thread of the application can keep doing other work, but the I/O operations all get processed as soon as possible by the worker thread.

Of course, this is not mandatory. An application might choose to not register a user event and simply wait for the completion of all events. But the two events allow different applications to choose the option that works best for them, creating an I/O completion mechanism that can be adjusted to suit different needs.

There is a function in KernelBase.dll to register the user completion event: SetIoRingCompletionEvent. We can find its signature in ioringapi.h:

STDAPI
SetIoRingCompletionEvent (
    _In_ HIORING ioRing,
    _In_ HANDLE hEvent
);

Using this new API and knowing how this new event operates, we can build a demo application that would look something like this:

HANDLE g_event;

DWORD
WaitOnEvent (
    LPVOID lpThreadParameter
    )
{
    HRESULT result;
    IORING_CQE cqe;

    WaitForSingleObject(g_event, INFINITE);
    while (TRUE)
    {
        //
        // lpThreadParameter is the handle to the ioring
        //
        result = PopIoRingCompletion((HIORING)lpThreadParameter, &cqe);
        if (result == S_OK)
        {
            /* do things */
        }
        else
        {
            WaitForSingleObject(g_event, INFINITE);
            ResetEvent(g_event);
        }
    }
    return 0;
}

int
main ()
{
    HRESULT result;
    HIORING ioring = NULL;
    IORING_CREATE_FLAGS flags;

    flags.Required = IORING_CREATE_REQUIRED_FLAGS_NONE;
    flags.Advisory = IORING_CREATE_ADVISORY_FLAGS_NONE;
    result = CreateIoRing(IORING_VERSION_3, flags, 0x10000, 0x20000, &ioring);

    /* Queue operations to ioring... */

    //
    // Create user completion event, register it to the ioring
    // and create a thread to wait on it and process completed operations.
    // The ioring handle is sent as an argument to the thread.
    //
    g_event = CreateEvent(NULL, FALSE, FALSE, NULL);
    result = SetIoRingCompletionEvent(handle, g_event);
    thread = CreateThread(NULL, 0, (LPTHREAD_START_ROUTINE)WaitOnEvent, ioring, 0, &threadId);
    result = SubmitIoRing(handle, 0, 0, &submittedEntries);

    /* Clean up... */

    return 0;
}

Drain Preceding Operations

The user completion event is a very cool addition, but it’s not the only waiting-related improvement to I/O rings. Another one can be found by looking at the NT_IORING_SQE_FLAGS enum:

typedef enum _NT_IORING_SQE_FLAGS
{
    NT_IORING_SQE_FLAG_NONE = 0x0,
    NT_IORING_SQE_FLAG_DRAIN_PRECEDING_OPS = 0x1,
} NT_IORING_SQE_FLAGS, *PNT_IORING_SQE_FLAGS;

Looking through the code, we can find a check for NT_IORING_SQE_FLAG_DRAIN_PRECEDING_OPS right in the beginning of IopProcessIoRingEntry:

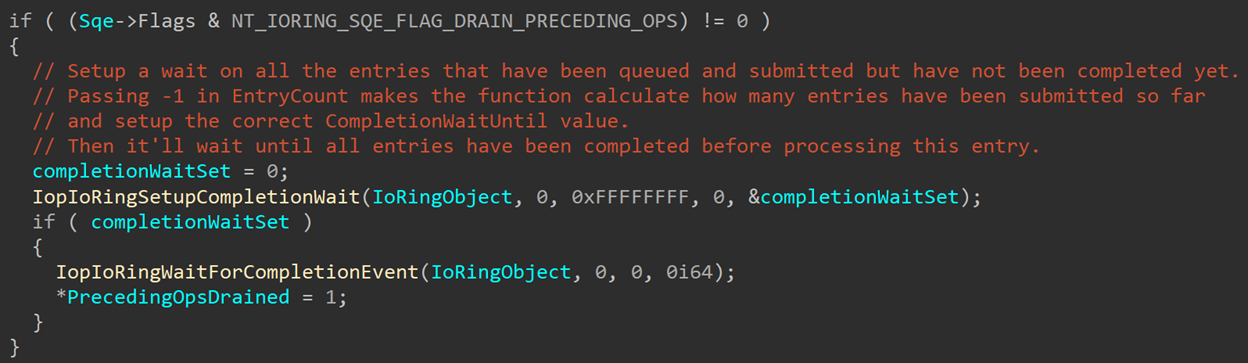
This check happens before any processing is done, to check if the submission queue entry contains the NT_IORING_SQE_FLAG_DRAIN_PRECEDING_OPS flag. If so, IopIoRingSetupCompletionWait is called to setup the wait parameters. The function signature looks something like this:

NTSTATUS
IopIoRingSetupCompletionWait (
    _In_ PIORING_OBJECT IoRingObject,
    _In_ ULONG SubmittedEntries,
    _In_ ULONG WaitOperations,
    _In_ BOOL SetupCompletionWait,
    _Out_ PBYTE CompletionWait
);

Inside the function there are a lot of checks and calculations that are both very technical and very boring, so I’ll spare myself the need to explain them and you the need to read through the exhausting explanation and skip to the good parts. Essentially, if the function receives -1 as the WaitOperations, it will ignore the SetupCompletionWait argument and calculate the number of operations that have already been submitted and processed but not yet completed. That number gets placed in IoRingObject->CompletionWaitUntil. It also sets IoRingObject->SignalCompletionEvent to TRUE and returns TRUE in the output argument CompletionWait.

If the function succeeded, IopProcessIoRingEntry will then call IopIoRingWaitForCompletionEvent, which will until IoRingObject->CompletionEvent is signaled. Now is the time to go back to the check we’ve seen earlier in IopCompleteIoRingEntry:

If SignalCompletionEvent is set (which it is, because IopIoRingSetupCompletionWait set it) and the number of completed events is equal to IoRingObject->CompletionWaitUntil, IoRingObject->CompletionEvent will get signaled to mark that the pending events are all completed. SignalCompletionEvent also gets cleared to avoid signaling the event again when it’s not requested.

When called from IopProcessIoRingEntry, IopIoRingWaitForCompletionEvent receives a timeout of NULL, meaning that it’ll wait indefinitely. This is something that should be taken under consideration when using the NT_IORING_SQE_FLAG_DRAIN_PRECEDING_OPS flag.

So to recap, setting the NT_IORING_SQE_FLAG_DRAIN_PRECEDING_OPS flag in a submission queue entry will make sure all preceding operations are completed before this entry gets processed. This might be needed in certain cases where one I/O operation relies on an earlier one.

But waiting on pending operations happens in one more case: When submitting an I/O ring. In my first post about I/O rings last year, I defined the NtSubmitIoRing signature like this:

NTSTATUS
NtSubmitIoRing (
    _In_ HANDLE Handle,
    _In_ IORING_CREATE_REQUIRED_FLAGS Flags,
    _In_ ULONG EntryCount,
    _In_ PLARGE_INTEGER Timeout
    );

My definition ended up not being entirely accurate. The more correct name for the third argument would be WaitOperations, so the accurate signature is:

NTSTATUS
NtSubmitIoRing (
    _In_ HANDLE Handle,
    _In_ IORING_CREATE_REQUIRED_FLAGS Flags,
    _In_opt_ ULONG WaitOperations,
    _In_opt_ PLARGE_INTEGER Timeout
    );

Why does this matter? Because the number you pass into WaitOperations isn’t used to process the ring entries (they are processed entirely based on SubmissionQueue->Head and SubmissionQueue->Tail), but to request the number of operations to wait on. So, if WaitOperations is not 0, NtSubmitIoRing will call IopIoRingSetUpCompletionWait before doing any processing:

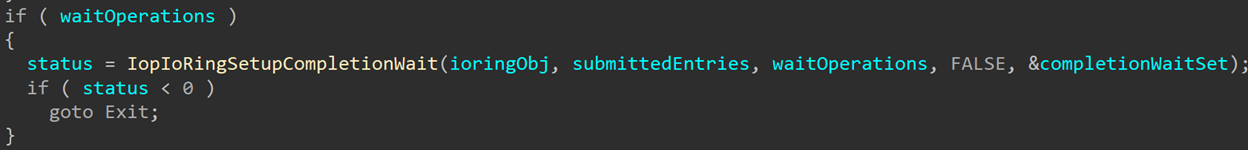
However, it calls the function with SetupCompletionWait=FALSE, so the function won’t actually setup any of the wait parameters, but only perform the sanity checks to see if the number of wait operations is valid. For example, the number of wait operations can’t be higher than the number of operations that were submitted. If the checks fail, NtSubmitIoRing won’t process any of the entries and will return an error, usually STATUS_INVALID_PARAMETER_3.

Later, we see both functions again after operations have been processed:

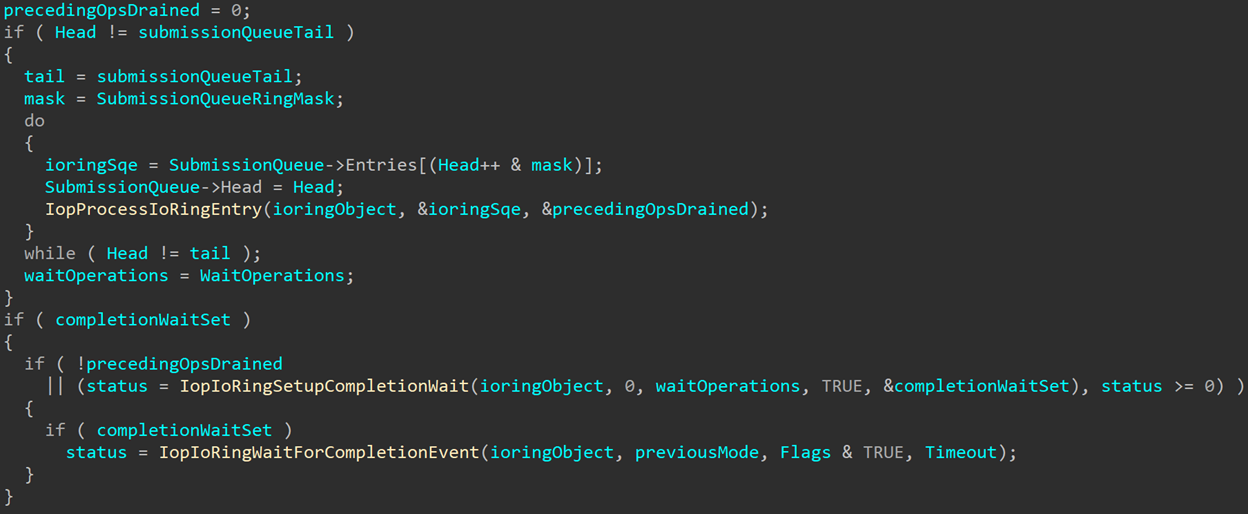
IopIoRingSetupCompletionWait is called again to recalculate the number of operations that need to be waited on, taking into consideration any operations that might have already been completed (or waited on already if any of the SQEs had the flag mentioned earlier). Then IopIoRingWaitForCompletionEvent is called to wait on IoRingObject->CompletionEvent until all requested events have been completed.
In most cases applications will choose to either send 0 as the WaitOperations argument or set it to the total number of submitted operations, but there may be cases where an application could want to only wait on part of the submitted operations, so it can choose a lower number to wait on.

Looking at Bugs

Comparing the same piece of code in different builds is a fun way of finding bugs that were fixed. Sometimes these are security vulnerabilities that gםt patched, sometimes just regular old bugs that can affect the stability or reliability of the code. The I/O ring code in the kernel received a lot of modifications over the past year, so this seems like a good chance to go hunting for old bugs.

One bug that I’d like to focus on here is pretty easy to spot and understand, but is a fun example for the way different parts of the system that seem entirely unrelated can clash in unexpected ways. This is a functional (not security) bug that prevented WoW64 processes from using some of the I/O ring features.

We can find evidence of this bug when looking at IopIoRingDispatchRegisterBuffers and IopIoRingispatchRegisterFiles. When looking at the new build we can see a piece of code that wasn’t there in earlier versions:

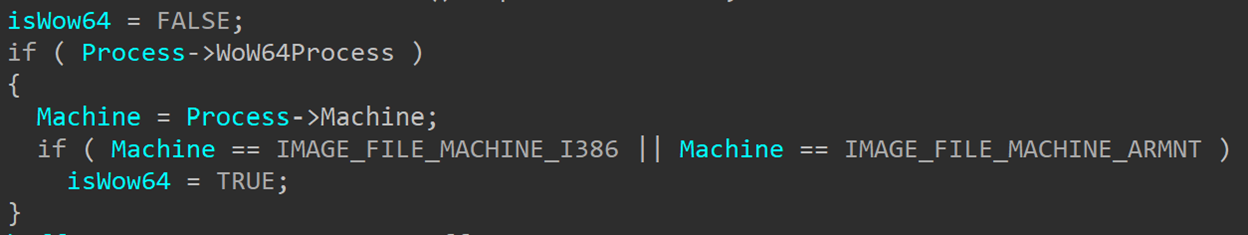
This is checking whether the process that is registering the buffers or files is a WoW64 process – a 32-bit process running on top of a 64-bit system. Since Windows now supports ARM64, this WoW64 process can now be either a x86 application or an ARM32 one.

Looking further ahead can show us why this information matters here. Later on, we see two cases where isWow64 is checked:

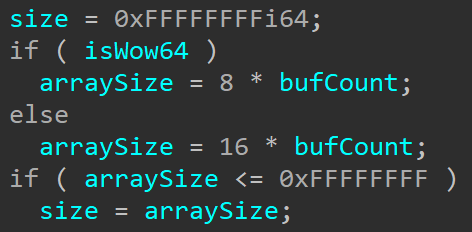
This first case is when the array size is being calculated to check for invalid sizes if caller is UserMode.

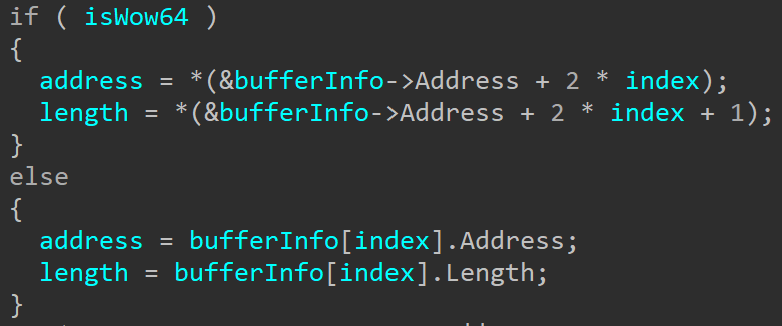
This second case happens when iterating over the input buffer to register the buffers in the array that will be stored in the I/O ring object. In this case it’s slightly harder to understand what we’re looking at because of the way the structures are handled here, but if we look at the disassembly it might become a bit clearer:

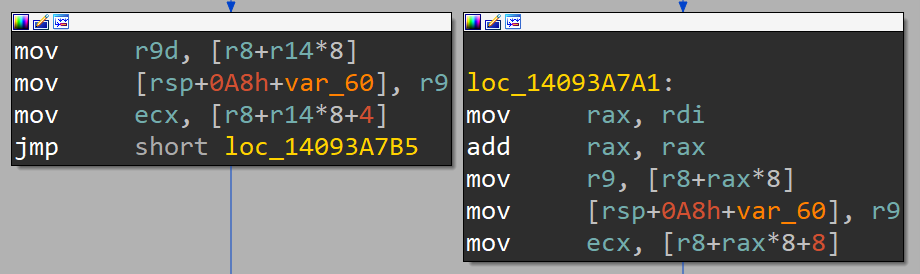
The block on the left is the WoW64 case and the block on the right is the native case. Here we can see the difference in the offset that is being accessed in the bufferInfo variable (r8 in the disassembly). To get some context, bufferInfo is read from the submission queue entry:

bufferInfo = Sqe->RegisterBuffers.Buffers;

When registering a buffer, the SQE will contain a NT_IORING_OP_REGISTER_BUFFERS structure:

typedef struct _NT_IORING_OP_REGISTER_BUFFERS
{
    /* 0x0000 */ NT_IORING_OP_FLAGS CommonOpFlags;
    /* 0x0004 */ NT_IORING_REG_BUFFERS_FLAGS Flags;
    /* 0x000c */ ULONG Count;
    /* 0x0010 */ PIORING_BUFFER_INFO Buffers;
} NT_IORING_OP_REGISTER_BUFFERS, *PNT_IORING_OP_REGISTER_BUFFERS;

The sub-structures are all in the public symbols so I won’t put them all here, but the one to focus on in this case is IORING_BUFFER_INFO:

typedef struct _IORING_BUFFER_INFO
{
    /* 0x0000 */ PVOID Address;
    /* 0x0008 */ ULONG Length;
} IORING_BUFFER_INFO, *PIORING_BUFFER_INFO; /* size: 0x0010 */

This structure contains an address and a length. The address is of type PVOID, and this is where the bug lies. A PVOID doesn’t have a fixed size across all systems. It is a pointer, and therefore its size depends on the size of a pointer on the system. On 64-bit systems that’s 8 bytes, and on 32-bit systems that’s 4 bytes. However, WoW64 processes aren’t fully aware that they are running on a 64-bit system. There is a whole mechanism put in place to emulate a 32-bit system for the process to allow 32-bit applications to execute normally on 64-bit hardware. That means that when the application calls BuildIoRingRegisterBuffers to create the array of buffers, it calls the 32-bit version of the function, which uses 32-bit structures and 32-bit types. So instead of using an 8-byte pointer, it’ll use a 4-byte pointer, creating an IORING_BUFFER_INFO structure that looks like this:

typedef struct _IORING_BUFFER_INFO
{
    /* 0x0000 */ PVOID Address;
    /* 0x0004 */ ULONG Length;
} IORING_BUFFER_INFO, *PIORING_BUFFER_INFO; /* size: 0x008 */

This is, of course, not the only case where the kernel receives pointer-sized arguments from a user-mode caller and there is a mechanism meant to handle these cases. Since the kernel doesn’t support 32-bit execution, the WoW64 emulation later is in charge of translating system call input arguments from the 32-bit sizes and types to the 64-bit types expected by the kernel. However in this case, the buffer array is not sent as an input argument to a system call. It is written into the shared section of the I/O ring that is read directly by the kernel, never going through the WoW64 translation DLLs. This means no argument translation is done on the array, and the kernel directly reads an array that was meant for a 32-bit kernel, where the Length argument is not at the expected offset. In the early versions of I/O ring this meant that the kernel always skipped the buffer length and interpreted the next entry’s address as the last entry’s length, leading to bugs and errors.

In newer builds, the kernel is aware of the differently shaped structure used by WoW64 processes, and interprets it correctly: It assumes that the size of each entry is 8 bytes instead of 0x10, and reads only the first 4 bytes as the address and the next 4 bytes as the length.

The same issue existed when pre-registering file handles, since a HANDLE is also the size of a pointer. IopIoRingDispatchRegisterFiles now has the same checks and processing to allow WoW64 processes to successfully register file handles as well.

Other Changes

There are a couple of smaller changes that aren’t large or significant enough to receive their own section of this post but still deserve an honorable mention:

  • The successful creation of a new I/O ring object will generate an ETW event containing all the initialization information in the I/O ring.
  • IoringObject->CompletionEvent received a promotion from NotificationEvent type to SynchronizationEvent.
  • Current I/O ring version is 3, so new rings created for recent builds should use this version.
  • Since different versions of I/O ring support different capabilities and operations, KernelBase.dll exports a new function: IsIoRingOpSupported. It receives the HIORING handle and the operation number, and returns a boolean indicating whether the operation is supported on this version.

Data Structures

One more exciting thing happened in Windows 11 22H2 (build 22577): nearly all the internal I/O ring structures are available in the public symbols! This means there is no longer a need to painfully reverse engineer the structures and try to guess the field names and their purposes. Some of the structures received major changes since 21H2, so not having to reverse engineer them all over again is great.

Since the structures are in the symbols there is no real need to add them here. However, structures from the public symbols aren’t always easy to find through a simple Google search – I highly recommend trying GitHub search instead, or just directly using ntdiff. At some point people will inevitably search for some of these data structures, find the REd structures in my old post, which are no longer accurate, and complain that they are out of date. To avoid that at least temporarily, I’ll only post here the updated versions of the structures that I had in the old post but will highly encourage you to get the up-to-date structures from the symbols – the ones here are bound to change soon enough (edit: one build later, some of them already did). So, here are some of the structures from Windows 11 build 22598:

typedef struct _NT_IORING_INFO
{
    IORING_VERSION IoRingVersion;
    NT_IORING_CREATE_FLAGS Flags;
    ULONG SubmissionQueueSize;
    ULONG SubmissionQueueRingMask;
    ULONG CompletionQueueSize;
    ULONG CompletionQueueRingMask;
    PNT_IORING_SUBMISSION_QUEUE SubmissionQueue;
    PNT_IORING_COMPLETION_QUEUE CompletionQueue;
} NT_IORING_INFO, *PNT_IORING_INFO;

typedef struct _NT_IORING_SUBMISSION_QUEUE
{
    ULONG Head;
    ULONG Tail;
    NT_IORING_SQ_FLAGS Flags;
    NT_IORING_SQE Entries[1];
} NT_IORING_SUBMISSION_QUEUE, *PNT_IORING_SUBMISSION_QUEUE;

typedef struct _NT_IORING_SQE
{
    enum IORING_OP_CODE OpCode;
    enum NT_IORING_SQE_FLAGS Flags;
    union
    {
        ULONG64 UserData;
        ULONG64 PaddingUserDataForWow;
    };
    union
    {
        NT_IORING_OP_READ Read;
        NT_IORING_OP_REGISTER_FILES RegisterFiles;
        NT_IORING_OP_REGISTER_BUFFERS RegisterBuffers;
        NT_IORING_OP_CANCEL Cancel;
        NT_IORING_OP_WRITE Write;
        NT_IORING_OP_FLUSH Flush;
        NT_IORING_OP_RESERVED ReservedMaxSizePadding;
    };
} NT_IORING_SQE, *PNT_IORING_SQE;

typedef struct _IORING_OBJECT
{
    USHORT Type;
    USHORT Size;
    NT_IORING_INFO UserInfo;
    PVOID Section;
    PNT_IORING_SUBMISSION_QUEUE SubmissionQueue;
    PMDL CompletionQueueMdl;
    PNT_IORING_COMPLETION_QUEUE CompletionQueue;
    ULONG64 ViewSize;
    BYTE InSubmit;
    ULONG64 CompletionLock;
    ULONG64 SubmitCount;
    ULONG64 CompletionCount;
    ULONG64 CompletionWaitUntil;
    KEVENT CompletionEvent;
    BYTE SignalCompletionEvent;
    PKEVENT CompletionUserEvent;
    ULONG RegBuffersCount;
    PIORING_BUFFER_INFO RegBuffers;
    ULONG RegFilesCount;
    PVOID* RegFiles;
} IORING_OBJECT, *PIORING_OBJECT;

One structure that isn’t in the symbols is the HIORING structure that represents the ioring handle in KernelBase. That one slightly changed since 21H2 so here is the reverse engineered 22H2 version:

typedef struct _HIORING
{
    HANDLE handle;
    NT_IORING_INFO Info;
    ULONG IoRingKernelAcceptedVersion;
    PVOID RegBufferArray;
    ULONG BufferArraySize;
    PVOID FileHandleArray;
    ULONG FileHandlesCount;
    ULONG SubQueueHead;
    ULONG SubQueueTail;
} HIORING, *PHIORING;

Conclusion

This feature barely just shipped a few months ago, but it’s already receiving some very interesting additions and improvements, aiming to make it more attractive to I/O-heavy applications. It’s already at version 3, and it’s likely we’ll see a few more versions coming in the near future, possibly supporting new operation types or extended functionality. Still, no applications seem to use this mechanism yet, at least on Desktop systems.

This is one of the more interesting additions to Windows 11, and just like any new piece of code it still has some bugs, like the one I showed in this post. It’s worth keeping an eye on I/O rings to see how they get used (or maybe abused?) as Windows 11 becomes more widely adapted and applications begin using all the new capabilities it offers.

HyperGuard Part 3 – More SKPG Extents

Hi all! And welcome to part 3 of the HyperGuard chronicles!

In the previous blog post I introduced SKPG extents – the data structures that describe the memory ranges and system components that should be monitored by HyperGuard. So far, I only covered the initialization extent and various types of memory extents, but those are just the beginning. In this post I will cover the rest of the extent types and show how they are used by HyperGuard to protect other areas of the system.

The next extent group to look into is MSR and Control Register extents:

MSR and Control Register Extents

This group contains the following extent types:

  • 0x1003: SkpgExtentMsr
  • 0x1006: SkpgExtentControlRegister
  • 0x100C: SkpgExtentExtendedControlRegister

These extent types are received from the normal kernel, but they are never added into the array at the end of the SKPG_CONTEXT or get validated during the runtime checks that I’ll describe in one of the next posts. Instead, they are used in yet another part of SKPG initialization.

After initializing the SKPG_CONTEXT in SkpgInitializeContext, SkpgConnect performs an IPI (Inter-Processor Interrupt). It performs this IPI by calling SkeGenericIpiCall with a target function and input data, and the function will call the target function on every processor and send the requested data. In this case, the target function is SkpgxInstallIntercepts and the input data contains the number of input extents and the matching array:

I will go over intercepts in a lot more detail in a future blog post, but to give some necessary context: SKPG can ask the hypervisor to intercept certain actions in the system, like memory access, register access or instructions. HyperGuard uses that ability to intercept access to certain MSRs and Control Registers (and other things, which I will talk about later) to prevent malicious modifications. HyperGuard uses the input extents to choose which MSRs and Control Registers to intercept, out of the list of accepted options.

Since each processor has its own set of MSRs and registers, HyperGuard needs to intercept the requested one on all processors. Therefore, SkpgxInstallIntercepts is called through an IPI, to make sure it’s called in the context of each processor.

Once in SkpgxInstallIntercepts, the function iterates over the array of input extents and handles the three types included in this group based on the data supplied in them. If you remember, each extent contains 0x18 bytes of type-specific data. For this group, this data contains the number of the MSR/Register to be intercepted as well as the processor number that it should be intercepted on. This means that there might be more that one input extent for each MSR or control register, each for a different processor number. Or MSRs and control registers might only be intercepted on certain processors but not on others, if that is what the normal kernel requested. The data structure in the input extent for MSRs and control register extents looks something like this:

typedef struct _MSR_CR_DATA
{
    ULONG64 Mask;
    ULONG64 Value;
    ULONG RegisterNumber;
    ULONG ProcessorNumber;
} MSR_CR_DATA, *PMSR_CR_DATA;

While iterating over the extents, the function checks if the extent type is of one of the three in this group, and if so whether the processor number in the extent matches the current processor. If so, it checks if the number of the MSR or control register matches one of the accepted ones. If the extent matches one of the accepted registers, a mask is fetched from an array in the SKPRCB – this array contains the needed masks for all accepted MSRs and control registers so the hypervisor can be asked to intercept them. All masks are collected, and when all extents have been examined the final mask is sent to ShvlSetRegisterInterceptMasks to be installed. The mask that is used to install the intercepts is the union HV_REGISTER_CR_INTERCEPT_CONTROL. It is documented and can be found here.

Now that the general process is covered, we can look into the accepted MSRs and control registers and understand why HyperGuard might want to protect them from modifications, starting from the MSRs:

SkpgExtentMsr

Patching certain MSRs is a popular operation for exploits and rootkits, allowing them to do things such as hooking system calls or disabling security features. Some of those MSRs are already periodically monitored by PatchGuard, but there are benefits to intercepting them through HyperGuard that I will cover later. The list of MSRs that can be intercepted keeps growing over time and receives new additions as new features and registers get added to CPUs, such as the implementation of CET which added multiple MSRs that might be a target for attackers. As of Windows 11 build 22598, the MSRs that can be intercepted by SKPG are:

  1. IA32_EFER (0xC0000080) – among other things, this MSR contains the NX bit, enforcing a mitigation that doesn’t allow code execution in addresses that aren’t specifically marked as executable. It also contains flags related to virtualization support.
  2. IA32_STAR (0xC0000081) – contains the address of the x86 system call handler.
  3. IA32_LSTAR (0xC0000082) – contains the address of the x64 system call handler – should normally be pointing to nt!KiSystemCall64.
  4. IA32_CSTAR (0xC0000083) – contains the address of the system call handler on x64 when running in compatibility mode – should normally be pointing to nt!KiSystemCall32.
  5. IA32_SFMASK (0xC0000084) – system call flags mask. Any bit set here when a system call is executed will be cleared from EFLAGS.
  6. IA32_TSC_AUX (0xC0000103) – usage depends on the operating system, but this MSR is generally used to store a signature, to be read together with a time stamp.
  7. IA32_APIC_BASE (0x1B) – contains the APIC base address.
  8. IA32_SYSENTER_CS (0x174) – contains the CS value for ring 0 code when performing system calls with SYSENTER.
  9. IA32_SYSENTER_ESP (0x175) – contains the stack pointer for the kernel stack when performing system calls with SYSENTER.
  10. IA32_SYSENTER_EIP (0x176) – contains the EIP value for ring 0 entry when performing system calls with SYSENTER.
  11. IA32_MISC_ENABLE (0x1A0) – controls multiple processor features, such as Fast Strings disable, performance monitoring and disable of the XD (no-execute) bit.
  12. MSR_IA32_S_CET (0x6A2) – controls kernel mode CET setting.
  13. IA32_PL0_SSP (0x6A4) – contains the ring 0 shadow stack pointer.
  14. IA32_PL1_SSP (0x6A5) – contains the ring 1 shadow stack pointer.
  15. IA32_PL2_SSP (0x6A6) – contains the ring 2 shadow stack pointer.
  16. IA32_INTERRUPT_SSP_TABLE_ADDR (0x6A8) – contains a pointer to the interrupt shadow stack table.
  17. IA32_XSS (0xDA0) – contains a mask to be used when XSAVE and XRESTOR instructions are called in kernel-mode. For example, it controls the saving and loading of the registers used by Intel Processor Trace (IPT).

SkpgExtentControlRegister

By modifying certain control registers an attacker can disable security features or gain control of execution. Currently SKPG supports intercepts of two control registers:

  1. CR0 – controls certain hardware configuration such as paging, protected mode and write protect.
  2. CR4 – controls the configuration of different hardware features. For example, driver signature enforcement, SMEP and UMIP bits control security features that make CR4 an interesting target for attackers using an arbitrary write exploit.

SkpgExtentExtendedControlRegister

Currently only one extended control register exists – XCR0. It’s used to toggle storing or loading of extended registers such as AVX, ZMM and CET registers, and can be intercepted and protected by SKPG.

Installing the Intercepts

Now that we know that registers can be intercepted and why, we can get back and look at the installation of the intercepts through ShvlSetRegisterInterceptMasks. The function receives a HV_REGISTER_CR_INTERCEPT_CONTROL mask to know which intercepts to install, as well as the values for a few of the intercepted registers – CR0, CR4 and IA32_MISC_ENABLE MSR. These are all placed in a structure that is passed into the function, which looks like this:

struct _REGISTER_INTERCEPT_INFORMATION
{
    HV_REGISTER_CR_INTERCEPT_CONTROL InterceptControl;
    ULONG64 Cr0Value;
    ULONG64 Cr4Value;
    ULONG64 Ia32MiscEnableValue;
} REGISTER_INTERCEPT_INFORMATION, *PREGISTER_INTERCEPT_INFORMATION;

The InterceptControl mask is built while iterating over the input extents, and the values for CR0, CR4 and IA32_MISC_ENABLE are read from the SKPRCB (their values, together with the values for all other potentially-intercepted registers, are placed there in SkeInitSystem, triggered from a secure call with code SECURESERVICE_PHASE3_INIT).

This structure is sent to ShvlSetRegisterInterceptMasks which in turn calls ShvlSetVpRegister on each of the four values in the input structure to register an intercept. Setting the register values is done by initiating a fast hypercall with a code of HvCallSetVpRegisters (0x51), sending on four arguments (for anyone interested, all hypercall values are documented here). The last two arguments are of types HV_REGISTER_NAME and HV_REGISTER_VALUE – these types are documented so it’s easy to see what registers are being set:

Looking at the function, we see that it’s setting the required values for CR0, CR4 and IA32_MISC_ENABLE, and finally setting the mask for intercept control, so from this point all requested registers are intercepted by the hypervisor and any access to them will be forwarded to the SKPG intercept routine.

Secure VA Translation Extents

In the previous post I introduced the secure extents – extents indicating VTL1 memory or data structures to be protected. I also covered memory extents, including the secure memory extents. Here is another kind of secure extents, which are initialized internally in the secure kernel, without using input extents from VTL0. They are called Secure VA Translation Extents and are initialized inside SkpgCreateSecureVaTranslationExtents. These extents are used to protect Virtual->Physical address translations for different pages or memory regions that are a common target for attack:

  • 0x100B: SkpgExtentProcessorMode
  • 0x100E: SkpgExtentLoadedModule
  • 0x100F: SkpgExtentProcessorState
  • 0x1010: SkpgExtentKernelCfgBitmap
  • 0x1011: SkpgExtentZeroPage
  • 0x1012: SkpgExtentAlternateInvertedFunctionTable
  • 0x1015: SkpgExtentSecureExtensionTable
  • 0x1017: SkpgExtentKernelVAProtection
  • 0x1019: SkpgExtentSecurePool

Though they are called secure extents, the data they protect is mostly VTL0 data, such as the VTL0 mapping of the KCFG bitmap or the inverted function table. The exact validations done differ between the types: for example, the zero page should never be mapped so a successful virtual->physical address translation of the zero page should not be acceptable, while the kernel CFG bitmap should have valid translations but the VTL0 mapping of those pages should always be read-only.

Looking at SkpgCreateSecureVaTranslationExtents, we can see that the extents are initialized with no input data or memory ranges:

This is because all of these extents correlate to specific data structures which are all initialized elsewhere so the data doesn’t need to be part of the extent itself, so the type is the only part that needs to be set. We can also see that some of these extents are only initialized when KCFG is enabled, since without it they are not needed. I will cover the checks done for each of these extents in a later blog post, which will describe SKPG extent verification.

Finally, if HotPatching is enabled, two more extents are added, both with type SkpgExtentExtensionTable:

These extents protect the SkpgSecureExtension and SkpgNtExtension variables, which keep track of HotPatching data.

Per-Processor Extents

There are two more extents that are processor-specific, since the data they protect exists separately in each processor. However, unlike the MSR and Control Register extents, no intercepts need to be installed and no function needs to be executed on all processors (for now). These extents are also received from the normal kernel and added to the array of extents in the SKPG_CONTEXT structure. The data received for each of these two extents includes base address, limit and a processor number, so multiple entries might exist for these extent types, with different processor numbers:

  • 0x1004: SkpgExtentIdt
  • 0x1005: SkpgExtentGdt

These extents contain the memory range for the GDT and IDT tables on each processor, so HyperGuard will protect them from malicious modifications.

Unused Extents

Extent types 0x1007, 0x1008, 0x1013 and 0x1018 never get initialized anywhere in SecureKernel.exe and don’t seem to be used anywhere. They may be deprecated or not fully implemented yet.

An Exercise in Dynamic Analysis

Analyzing the PayloadRestrictions.dll Export Address Filtering

This post is a bit different from my usual ones. It won’t cover any new security features or techniques and won’t share any novel security research. Instead, it will guide you through the process of analyzing an unknown mitigation through a real-life example in Windows Defender Exploit Guard (formerly EMET). Because the goal here is to show a step-by-step, real life research process, the post will be a bit disorganized and will follow a more organic and messy train of thought.

A brief explanations of the Windows Defender Exploit Guard: formerly known as EMET, this is a DLL that gets injected on demand and implements several security mitigations such as Export Address Filtering, Import Address Filtering, Stack Integrity Validations, and more. These are all disabled by default and need to be manually enabled in the Windows security settings, either for a specific process or for the whole system. Since it was acquired by Microsoft, these mitigations are implemented in PayloadRestrictions.dll, which can be found in C:\Windows\System32.

This post will follow one of these mitigations, named Export Address Filtering (or EAF). This tutorial will demonstrate a step-by-step guide for analyzing this mitigation, using both dynamic analysis in WinDbg and static analysis in IDA and Hex Rays. I’ll try to highlight the things that should be focused on when analyzing a mitigation and show that even with partial information we can reach useful conclusions and learn about this feature.

First, we’ll enable EAF in calc.exe in the Windows Security settings:

We don’t know anything about this mitigation yet other than that one line descriptions in the security settings, so we’ll start by running calc.exe under a debugger to see what happens. Immediately we can see PayloadRestrictions.dll get loaded into the process:

And almost right away we get a guard page violation:

What is in this mysterious address and why does accessing it throw a guard page violation?

To start finding out the answer to the first question  we can run !address to get a few more details about the address causing the exception:

!address 00007ffe`3da6416c
 
Usage:                  Image
Base Address:           00007ffe`3d8b9000
End Address:            00007ffe`3da7a000
Region Size:            00000000`001c1000 (   1.754 MB)
State:                  00001000          MEM_COMMIT
Protect:                00000002          PAGE_READONLY
Type:                   01000000          MEM_IMAGE
Allocation Base:        00007ffe`3d730000
Allocation Protect:     00000080          PAGE_EXECUTE_WRITECOPY
Image Path:             C:\WINDOWS\System32\kernelbase.dll
Module Name:            kernelbase
Loaded Image Name:
Mapped Image Name:
More info:              lmv m kernelbase
More info:              !lmi kernelbase
More info:              ln 0x7ffe3da6416c
More info:              !dh 0x7ffe3d730000
 
 
Content source: 1 (target), length: 15e94

Now we know that this address is in a read-only page inside KernelBase.dll. But we don’t have any information that will help us understand what this page is and why it’s guarded. Let’s follow the suggestion of the command output and run !dh to dump the headers of KernelBase.dll to get some more information (showing partial output here since full output is very long):

!dh 0x7ffe3d730000

File Type: DLL
FILE HEADER VALUES
8664 machine (X64)
7 number of sections
FE317FB0 time date stamp Sat Feb 21 05:53:36 2105

0 file pointer to symbol table
0 number of symbols
F0 size of optional header
2022 characteristics
Executable
App can handle >2gb addresses
DLL

OPTIONAL HEADER VALUES
20B magic #
14.30 linker version
188000 size of code
211000 size of initialized data
0 size of uninitialized data
89FE0 address of entry point
1000 base of code
----- new -----
00007ffe3d730000 image base
1000 section alignment
1000 file alignment
3 subsystem (Windows CUI)
10.00 operating system version
10.00 image version
10.00 subsystem version
39A000 size of image
1000 size of headers
3A8E61 checksum
0000000000040000 size of stack reserve
0000000000001000 size of stack commit
0000000000100000 size of heap reserve
0000000000001000 size of heap commit
4160 DLL characteristics
High entropy VA supported
Dynamic base
NX compatible
Guard
334150 [ F884] address [size] of Export Directory
3439D4 [ 50] address [size] of Import Directory
369000 [ 548] address [size] of Resource Directory
34F000 [ 18828] address [size] of Exception Directory
397000 [ 92D0] address [size] of Security Directory
36A000 [ 2F568] address [size] of Base Relocation Directory
29B8C4 [ 70] address [size] of Debug Directory
0 [ 0] address [size] of Description Directory
0 [ 0] address [size] of Special Directory
255C20 [ 28] address [size] of Thread Storage Directory
1FB6D0 [ 140] address [size] of Load Configuration Directory
0 [ 0] address [size] of Bound Import Directory
2569D8 [ 16E0] address [size] of Import Address Table Directory
331280 [ 620] address [size] of Delay Import Directory
0 [ 0] address [size] of COR20 Header Directory
0 [ 0] address [size] of Reserved Directory

Our faulting address is 0x7ffe3da6416c, which is at offset 0x33416c inside KernelBase.dll. Looking for the closest match in the output of !dh we can find the export directory at offset 0x334150:

334150 [    F884] address [size] of Export Directory

So the faulting code is trying to access an entry in the KernelBase export table. That shouldn’t happen under normal circumstances – if you debug another process (one that doesn’t have EAF enabled) you will not see any exceptions being thrown when accessing the export table. So we can guess that PayloadRestrictions.dll is causing this, and we’ll soon see how and why it does it.

One thing to note about guard page violations is this, quoted from this MSDN page:

If a program attempts to access an address within a guard page, the system raises a STATUS_GUARD_PAGE_VIOLATION (0x80000001) exception. The system also clears the PAGE_GUARD modifier, removing the memory page’s guard page status. The system will not stop the next attempt to access the memory page with a STATUS_GUARD_PAGE_VIOLATION exception.

So this guard page violation should only happen once and then get removed and never happen again. However, if we continue the execution of calc.exe, we’ll soon see another page guard violation on the same address:

This means the guard page somehow came back and is set on the KernelBase export table again.

The best guess in this case would probably be that someone registered an exception handler which gets called every time a guard page violation happens and immediately sets the PAGE_GUARD flag again, so that the same exception happens next time anything accesses the export table. Unfortunately, there is no good way to view registered exception handlers in WinDbg (unless setting the “enable exception logging” in gflags, which enables the !exrlog extension but I won’t be doing that now). However, we know that the DLL registering the suspected exception handler is most likely PayloadRestrictions.dll, so we’ll open it in IDA and take a look.

When looking for calls to RtlAddVectoredExceptionHandler, the function used to register exception handlers, we only see two results:

Both register the same exception handler — MitLibExceptionHandler:

(on a side note – I don’t often choose to use the IDA disassembler instead of the Hex Rays decompiler but PayloadRestrictions.dll uses some things that the decompiler doesn’t handler too well so I’ll be switching between the disassembler and decompiler code in this post)

We can set a breakpoint on this exception handler and see that it gets called from the same address that threw the page guard violation exception earlier (ntdll!LdrpSnapModule+0x23b):

Looking at the exception handler itself we can see it’s quite simple:

It only handles two exception codes:

  1. STATUS_GUARD_PAGE_VIOLATION
  2. STATUS_SINGLE_STEP

When a guard page violation happens, we can see MitLibValidateAccessToProtectedPage get called. Looking at this function, we can tell that a lot of it is dedicated to checks related to Import Address Filtering. We can guess that based on the address comparisons to the global IatShadowPtr variable and calls to various IAF functions:

Some of the code here is relevant for EAF, but for simplicity we’ll skip most of it (for now). Just by quickly scanning through this function and all the ones called by it, it doesn’t look like anything here is resetting the PAGE_GUARD modifier on the export table page.

What might give us a hint is to go back to WinDbg and continue program execution:

We’re immediately hitting another exception at the next instruction, this time its one of type single step exception. A single step exception is one normally triggered by debuggers when requesting a single step, such as when walking a function instruction by instruction. But in this case I asked the debugger to continue the execution, not do a single step, so it wasn’t WinDbg that triggered this exception.

The way a single step instruction is triggered is by setting the Trap Flag (bit 8) in the EFLAGS register inside the context record. And if we look towards the end of MitLibValidateAccessToProtectedPage we can see it doing exactly that:

So far we’ve seen PayloadRestrictions.dll do the following:

  1. Set the PAGE_GUARD modifier on the export table page.
  2. When the export table page is accessed, catch the exception with MitLibExceptionHandler and call MitLibValidateAccessToProtectedPage if this is a guard page violation.
  3. Set the Trap Flag in EFLAGS to generate a single step exception on the next instruction once execution resumes.

This matches the fact that MitLibExceptionHandler handles exactly two exception codes – guard page violations and single steps. So on the next instruction we receive the now expected single step exception and go right into MitLibHandleSingleStepException:

This is obviously a cleaned-up version of the original output. I saved you some of the work of checking what the global variables are and renaming them since this isn’t an especially interesting step – for example to check what function is pointed to by the variable I named pNtProtectVirtualMemory I simply dumped the pointer in WinDbg and saw it pointing to NtProtectVirtualMemory.

Back to the point – there are some things in this function that we’ll ignore for now and come back to later. What we can focus on is the call to NtProtectVirtualMemory, which (at least through one code path) sets the protection to PAGE_GUARD and PAGE_READONLY. Even without fully understanding everything we can make an educated guess and say that this is most likely the place where the KernelBase.dll export table guard page flag gets reset.

Now that we know the mechanism behind the two exceptions we’re seeing, we can go back to MitLibValidateAccessToProtectedPage to go over all the parts we skipped earlier and see what happens when a guard page violation occurs. First thing we see is a check to see if the faulting address in inside the IatShadow page. We can keep ignoring this one since it’s related to another feature (IAF) that we haven’t enabled for this process. We move on to the next section, which I titled FaultingAddressIsNotInShadowIat:

I already renamed some of the variables used here for convenience, but we’ll go over how I reached those names and titles and what this whole section does. First, we see the DLL using three global variables – g_MitLibState, a large global structure that contains all sorts of data used by PayloadRestrictions.dll, and two unnamed variables that I chose to call NumberOfModules and NumberOfProtectedRegions – we’ll soon see why I chose those names.

At a first glance, we can tell that this code is running in a loop. In each iteration it accesses some structure in g_MitLibState+0x50+index. This means there is some array at g_MitLibState+0x50, where each entry is some unknown structure. From this code, we can tell that each structure in the array in sized 0x28 bytes. Now we can either try to statically search for the function in the DLL that initializes this array and try to figure out what the structure contains, or we can go back to WinDbg and dump the already-initialized array in memory:

When dumping unknown memory it’s useful to use the dps command to check if there are any known symbols in the data. Looking at the array in memory we can see there are 3 entries. Using the we see that the first field in each of the structures is the base address of one module: Ntdll, KernelBase and Kernel32. Immediately following it there is a ULONG. Based on the context and the alignment we can guess that this might be the size of the DLL. A quick WinDbg query shows that this is correct:

0:007> dx @$curprocess.Modules.Where(m => m.Name.Contains("ntdll.dll")).Select(m => m.Size)
@$curprocess.Modules.Where(m => m.Name.Contains("ntdll.dll")).Select(m => m.Size)                
    [0x19]           : 0x211000
0:007> dx @$curprocess.Modules.Where(m => m.Name.Contains("kernelbase.dll")).Select(m => m.Size)
@$curprocess.Modules.Where(m => m.Name.Contains("kernelbase.dll")).Select(m => m.Size)                
    [0x7]            : 0x39a000
0:007> dx @$curprocess.Modules.Where(m => m.Name.Contains("kernel32.dll")).Select(m => m.Size)
@$curprocess.Modules.Where(m => m.Name.Contains("kernel32.dll")).Select(m => m.Size)                
    [0xc]            : 0xc2000

Next we have a pointer to the base name of the module:

0:007> dx -r0 (wchar_t*)0x00007ffe1a4926b0
(wchar_t*)0x00007ffe1a4926b0                 : 0x7ffe1a4926b0 : "ntdll.dll" [Type: wchar_t *]
0:007> dx -r0 (wchar_t*)0x00000218f42a7d68
(wchar_t*)0x00000218f42a7d68                 : 0x218f42a7d68 : "kernelbase.dll" [Type: wchar_t *]
0:007> dx -r0 (wchar_t*)0x00000218f42a80c8
(wchar_t*)0x00000218f42a80c8                 : 0x218f42a80c8 : "kernel32.dll" [Type: wchar_t *]

And another pointer to the full path of the module:

0:007> dx -r0 (wchar_t*)0x00000218f42a7970
(wchar_t*)0x00000218f42a7970                 : 0x218f42a7970 : "C:\WINDOWS\SYSTEM32\ntdll.dll" [Type: wchar_t *]
0:007> dx -r0 (wchar_t*)0x00000218f42a7d40
(wchar_t*)0x00000218f42a7d40                 : 0x218f42a7d40 : "C:\WINDOWS\System32\kernelbase.dll" [Type: wchar_t *]
0:007> dx -r0 (wchar_t*)0x00000218f42a80a0
(wchar_t*)0x00000218f42a80a0                 : 0x218f42a80a0 : "C:\WINDOWS\System32\kernel32.dll" [Type: wchar_t *]

Finally we have a ULONG that is used in this function to indicate whether or not to check this range, so I named it CheckRipInModuleRange. When put together, we can build the following structure:

typedef struct _MODULE_INFORMATION {
    PVOID ImageBase;
    ULONG ImageSize;
    PUCHAR ImageName;
    PUCHAR FulleImagePath;
    ULONG CheckRipInModuleRange;
} MODULE_INFORMATION, *PMODULE_INFORMATION;

We could define this structure in IDA and get a much nicer view of the code but I’m trying to keep this post focused on analyzing this feature so I just annotated the idb with the field names.

Now that we know what this array contains we can have a better idea of what this code does – It iterates over the structures in this array and checks if the instruction pointer that accessed the guarded page is inside one of those modules. When the loop is done – or the code found that the faulting RIP is in one of those modules – it sets r8 to the index of the module (or leaves it as -1 if a module is not found) and moves on to the next checks:

Here we have another loop, this time iterating over an array in g_MitLibState+0x5D0, where each structure is sized 0x18, and comparing it to the address that triggered the exception (in our case, the address inside the KernelBase export table). Now we already know what to do so we’ll go and dump that array in memory:

We have here three entries, each containing what looks like a start address, end address and some flag. Let’s see what each of these ranges are:

  1. First range starts at the base address of NTDLL and spans 0x160 bytes, so pretty much covers the NTDLL headers.
  2. Second range is one we’ve been looking at since the beginning of the post – this is the KernelBase.dll export table.
  3. Third range is the Kernel32.dll export table (I won’t show how we can find this out because we’ve done this for KernelBase earlier in the post).

It’s safe to assume these are the memory regions that PayloadRestrictions.dll protects and that this check is meant to check that this guard page violation was triggered for one of its protected ranges and not some other guarded page in the process.

I won’t go into as many details for the other checks in this function because that would mostly involve repeating the same steps over and over and this post is pretty long as it is. Instead we’ll look a bit further ahead at this part of the function:

This code path is called if the instruction pointer is found in one of the registered modules. Even without looking inside any of the functions that are called here we can guess that MitLibMemReaderGadgetCheck looks at the instruction that accessed the guarded page and compares them to the expected instructions, and MitLibReportAddressFilterViolation is called to report unexpected behavior if the instructions is considered “bad”.

A different path is taken if the saved RIP is not in one of the known modules, which involved two final checks. The first checks if the saved RSP is inside the stack, and if it isn’t MitLibReportAddressFilterViolation is called to report potential exploitation:

The second calls RtlPcToFileHeader to get the base address of the module that the saved RIP is in and reports a violation if one is not found since that means the guarded page was accessed from within dynamic code and not an image:

All cases where MitLibReportAddressFilterViolation is called will eventually lead to a call to MitLibTriggerFailFast:

This ends up terminating the process, therefore blocking the potential exploit. If no violation is found, the function enables a single step exception for the next instruction that’ll run and the whole cycle begins again.

Of course we can keep digging into the DLL to learn about the initialization of this feature, the gadgets being searched for or what happens when a violation is reported, but I’ll leave those as assignments for someone else. For now we managed to get a good understanding of what EAF is and how it works that will allow us to further analyze it or search for potential bypasses, as well as getting some tools for analyzing similar mechanisms in PayloadRestrictions.dll or other security products.

HyperGuard – Secure Kernel Patch Guard: Part 2 – SKPG Extents

Welcome to Part 2 of the series about Secure Kernel Patch Guard, also known as HyperGuard. This part will start describing the data structure and components of SKPG, and more specifically the way it’s activated. If you missed Part 1, you can find it right here.

Inside HyperGuard Activation

In Part 1 of the series I introduced HyperGuard and described its different initialization paths. Whichever path we went through, we end up reaching SkpgConnect when the normal kernel finished its initialization. This is when all important data structures in the kernel have already been initialized and can start being monitored and protected by PatchGuard and HyperGuard.

After a couple of standard input validations, SkpgConenct acquires SkpgConnectionLock and checks the SkpgInitialized global variable to tell if HyperGuard has already been initialized. If the variable is set, the function will return STATUS_ACCESS_DENIED or STATUS_SUCCESS, depending on the information received. In either of those cases, it will do nothing else.

If SKPG has not been initialized yet, SkpgConnect will start initializing it. First it calculates and saves multiple random values to be used in several different checks later on. Then it allocates and initializes a context structure, saved in the global SkpgContext. Before we move on to other SKPG areas, it’s worth spending a bit of time talking about the SKPG context.

SKPG Context

This SKPG context structure is allocated and Initialized in SkpgConnect and will be used in all SKPG checks. It contains all the data needed for HyperGuard to monitor and protect the system, such as the NT PTE information, encryption algorithms, KCFG ranges, and more, as well as another timer and callback, separate to the ones we saw in the first part of the series. Unfortunately, like the rest of HyperGuard, this structure, which I’ll call SKPG_CONTEXT, is not documented and so we need to do our best to figure out what it contains and how it’s used.

First, the context needs to be allocated. This context has a dynamic size that depends on the data received from the normal kernel. Therefore, it is calculated at runtime using the function SkpgComputeContextSize. The minimal size of the structure is 0x378 bytes (this number tends to increase every few Windows builds as the context structure gains new fields) and to that will be added a dynamic size, based on the data sent from the normal kernel.

That input data, which is only sent when SKPG is initialized through the PatchGuard code paths, is an array of structures named Extents. These extents describe different memory regions, data structures and other system components to be protected by HyperGuard. I will cover all of these in more detail later in the post, but a few examples include the GDT and IDT, data sections in certain protected modules and MSRs with security implications.

After the required size is calculated, the SKPG_CONTEXT structure is allocated and some initial fields are set in SkpgAllocateContext. A couple of these fields include another secure timer and a related callback, whose functions are set to SkpgHyperguardTimerRoutine and SkpgHyperguardRuntime. It also sets fields related to PTE addresses and other paging-related properties, since a lot of the HyperGuard checks validate correct Virtual->Physical page translations.

Afterwards, SkpgInitializeContext is called to finish initializing the context using the extents provided by the normal kernel. This basically means iterating over the input array, using the data to initialize internal extent structures, that I’ll call SKPG_EXTENT, and sticking them at the end of the SKPG_CONTEXT structure, with a field I chose to call ExtentOffset pointing to the beginning of the extent array (notice that none of these structures are documented, so all structure and field names are made up):

SKPG Extents

There are many different types of extents, and each SKPG_EXTENT structure has a Type field indicating its type. Each extent also has a hash, used in some cases to validate that no changes were done to the monitored memory region. Then there are fields for the base address of the monitored memory and the number of bytes, and finally a union that contains data unique to each extent type. For reference, here is the reverse engineered SKPG_EXTENT structure:

typedef struct _SKPG_EXTENT
{
    USHORT Type;
    USHORT Flags;
    ULONG Size;
    PVOID Base;
    ULONG64 Hash;
    UCHAR TypeSpecificData[0x18];
} SKPG_EXTENT, *PSKPG_EXTENT;

I mentioned that the input extents used by HyperGuard were provided by the PatchGuard initializer function in the normal kernel. But SKPG initializes another kind of extents as well – secure extents. To initialize those, SkpgInitializeContext calls into SkpgCreateSecureKernelExtents, providing the SKPG_CONTEXT structure and the address where the current extent array ends – so the secure extents can be placed there. Secure extents use the same SKPG_EXTENT structure as regular extents and protect data in the secure kernel, such as modules loaded into the secure kernel and secure kernel memory ranges.

Extent Types

Like I mentioned, there are many different types of extents, each used by HyperGuard to protect a different part of the system. However, we can split them into a few groups that share similar traits and are handled in a similar way. For clarity and to separate normal extents from  secure extents, I will use the naming convention SkpgExtent for normal extent types and SkpgExtentSecure for secure extent types.

The first extent that I’d like to cover is a pretty simple one that always gets sent to SkpgInitializeContext regardless of other input:

Initialization Extent

There is one extent that doesn’t belong in any of the groups since it is not involved in any of the HyperGuard validations. This is extent 0x1000: SkpgExtentInit – this extent is not copied to the array in the context structure. Instead, this extent type is created by SkpgConnect and sent into SkpgInitializeContext to set some fields in the context structure itself that were previously unpopulated. These fields have additional hashes and information related to hotpatching, such as whether it is enabled and the addresses of the retpoline code pages. It also sets some flags in the context structure to reflect some configuration options in the machine.

Memory and Module Extents

This group includes the following extent types:

  • 0x1001: SkpgExtentMemory
  • 0x1002: SkpgExtentImagePage
  • 0x1009: SkpgExtentUnknownMemoryType
  • 0x100A: SkpgExtentOverlayMemory
  • 0x100D: SkpgExtentSecureMemory
  • 0x1014: SkpgExtentPartialMemory
  • 0x1016: SkpgExtentSecureModule

The thing all these extent types have in common is that they all indicate some memory range to be protected by HyperGuard. Most of these contain memory ranges in the normal kernel, however SkpgExtentSecureMemory and SkpgExtentSecureModule have VTL1 memory ranges and modules. Still, all these extent types are handled in a similar way regardless of the memory type or VTL so I grouped them together.

When normal memory extents are being added to the SKPG Context, all normal kernel address ranges get validated to ensure that the pages have a valid mapping for SKPG protection. For a normal kernel page to be valid for SKPG protection, the page can’t be writable. SKPG will monitor all requested pages for changes, so a writable page, whose contents can change at any time, is not a valid “candidate” for this kind of protection. Therefore, SKPG can only monitor pages whose protection is either “read” or “execute”. Obviously, only valid pages (as indicated by the Valid bit in the PTE) can be protected. There are slight differences to some of the memory extents when HVCI is enabled as SKPG can’t handle certain page types in those conditions.

Once mapped and verified, each memory page that should be protected gets hashed, and the hash gets saved into the SKPG_EXTENT structure where it will be used in future HyperGuard checks to validate that the page wasn’t modified.

Some memory extents describe a generic memory range, and some, like SkpgExtentImagePage, describe a specific memory type that needs to be treated slightly differently. This extent type mentions a specific image in the normal kernel, but HyperGuard should not be protecting the whole image, only a part of it. So the input extent has the image base, the page offset inside the image where the protection should start and the requested size. Here too the memory region to be protected will be hashed and the hash will be saved into the SKPG_EXTENT to be used in future validations.

But the SKPG_EXTENT structures that get written into the SKPG Context normally only describe a single memory page while the system might want to protect a much larger area in an image. It is simply easier for HyperGuard to handle memory validations one page at a time, to make for more predictable processing time and avoid taking up too much time while hashing large memory ranges, for example. So, when receiving an input extent where the requested size is larger than a page (0x1000 bytes), SkpgInitializeContext iterates over all the pages in the requested range and creates a new SKPG_EXTENT for each of them. Only the first extent, describing the first page in the range, receives the type SkpgExtentImage. All the other ones that describe the following pages receive a different type, 0x1014, which I chose to call SkpgExtentPartialMemory, and the original extent type is placed in the first 2 bytes in the type-specific data inside the SKPG_EXTENT structure.

Every extent in the array can be marked by different flags. One of these is the Protected flag, which can only be applied to normal kernel extents, meaning that the specified address range should be protected from changes by SKPG. In this case, SkpgInitializeContext will call SkmmPinNormalKernelAddressRange on the requested address range to pin in and prevent it from being freed by VTL0 code:

The secure memory extents essentially behave very similar to the normal memory extent, with the main differences being that they are initialized by the secure kernel itself and the details of what they are protecting.

Extents of type SkpgExtentSecureModule are generates to monitor all images loaded into the secure kernel space. This is done by iterating the SkLoadedModuleList global list, which, like the normal kernel’s PsLoadedModuleList, is a linked list of KLDR_DATA_TABLE_ENTRY structures representing all loaded modules. For each one of those modules, SkpgCreateSecureModuleExtents is called to generate the extents.

To do so, SkpgCreateSecureModuleExtents receives a KLDR_DATA_TABLE_ENTRY for one loaded DLL at a time, validates that it exists in PsInvertedFunctionTable (a table containing basic information for all loaded DLLs, mostly used for quick search for exception handlers) and then enumerates all the sections in the module. Most sections in a secure module are monitored using an SKPG_EXTENT but are not protected from modifications. Only one section is being protected, the TABLERO section:

The TABLERO section is a data section that exists in only a handful of binaries. In the normal kernel it exists in Win32k.sys, where it contains the win32k system service table. In the secure kernel a TABLERO section exists in securekernel.exe, where it contains global variables such as SkiSecureServiceTable, SkiSecureArgumentTable, SkpgContext, SkmiNtPteBase, and others:

When SkpgCreateSecureModuleExtents encounters a TABLERO section, it calls SkmmProtectKernelImageSubsection to change the PTE for the section pages from the default read-write to read only.

Then for each section, regardless of its type, an extent with type SkpgExtentSecureModule is created. Each memory region gets hashed a flag in the extent marks if the section is executable. The number of extents generated per section can vary: If HotPatching is enabled on the machine a separate extent will be generated for every page in the protected image ranges. Otherwise, every protected section generates one extent that might cover multiple pages, all of them with type SkpgExtentSecureModule:

If HotPatching is enabled, one last secure module extent gets created for each secure module. The variable SkmiHotPatchAddressReservePages will indicate how many pages are reserved for HotPatch use at the end of the module, and an extent gets created for each of those pages. Similar to the way described earlier for normal kernel module extents, each extent describes a single page, the extent type is SkpgExtentPartialMemory and the type SkpgExtentSecureModule is placed in one of the type-specific fields of the extent.

Another secure extent type is SkpgExtentSecureMemory. This is a generic extent type used to indicate any memory range in the secure kernel. However, for now it is only used to monitor the GDT pointed to by the secure kernel processor block – the SKPRCB. This is an internal structure that is similar in its purpose to the normal kernel’s KPRCB (and similarly, an array of them exists in SkeProcessorBlock). There will be one extent of this type for each processor in the system. Additionally, the function sets a bit in the Type field of each KGDTENTRY64 structure to indicate that this entry has been accessed and prevent it from being modified later on – but the entry for the TSS at offset 0x40 gets skipped:

This pretty much covers the initialization and uses of the memory extents. But this is just the first group of extents, and there are many others that monitor various different parts of the system. In the next post I’ll talk about more of these other extent types, which interact with system components like MSRs, control registers, the KCFG bitmap and more!