
If you spent any time writing or researching filter drivers, you may have run into filter communication ports. This is a standard communication method between a filter driver and its user-mode process, implemented and managed by the filter manager (FltMgr.sys). The ports allow the process and the drivers to send messages back and forth. Ports are named, so that processes can easily find and connect to them, and they allow the filter driver to decide who can get access to the port through a security descriptor, a maximum connection number field and a method that gets invoked whenever a new connection attempt is made, allowing the driver to dynamically allow or deny a specific connection request.
If you’re interested in learning how to create and use communication ports, I recommend taking a look at the Windows Driver Samples Github repository. In this post, I’ll focus on the forensics side and see how we can investigate filter communication ports to get some interesting information. Specifically, I’ll show how we can answer two questions:
- How can we find out what communication ports a filter driver created?
- Which user-mode processes are connected to a communication port?
As usual, I conduct my investigation in WinDbg kernel debugging session.
Finding Communication Ports
We can answer the first question easily. To find out what ports are created by a filter driver we can use the FltKd extension – one of the many useful debugger extensions provided in the SDK. This extension DLL isn’t always loaded by default so you might have to manually load the DLL into the debugger with the .load command. The DLL should be in "C:\Program Files (x86)\Windows Kits\10\Debuggers\x64\winxp\fltkd.dll" if you are using the legacy debugger or under the WinDbg Preview installation path if you are using Preview.
FltKd has several useful commands to debug filter drivers (you can see them all by running !fltkd.help). The first command will use is !fltkd.filters, which shows all the registered filters in the system:
!fltkd.filters

Filter List: ffff9c8f51af0320 "Frame 0"
    FLT_FILTER: ffff9c8f5bce7010 "bindflt" "409800"
      FLT_INSTANCE: ffff9c8f6aa51010 "bindflt Instance" "409800"
   FLT_FILTER: ffff9c8f55b86ba0 "FsDepends" "407000"
      FLT_INSTANCE: ffff9c8f554c1b40 "FsDepends" "407000"
      FLT_INSTANCE: ffff9c8f554ca6a0 "FsDepends" "407000"
      FLT_INSTANCE: ffff9c8f68fd2010 "FsDepends" "407000"
      FLT_INSTANCE: ffff9c8f68fea930 "FsDepends" "407000"
      FLT_INSTANCE: ffff9c8f68fea4a0 "FsDepends" "407000"
      FLT_INSTANCE: ffff9c8f68fea010 "FsDepends" "407000"
   FLT_FILTER: ffff9c8f53d3dab0 "WdFilter" "328010"
      FLT_INSTANCE: ffff9c8f53eb48a0 "WdFilter Instance" "328010"
      FLT_INSTANCE: ffff9c8f551398e0 "WdFilter Instance" "328010"
      FLT_INSTANCE: ffff9c8f553858e0 "WdFilter Instance" "328010"
      FLT_INSTANCE: ffff9c8f55643010 "WdFilter Instance" "328010"
      FLT_INSTANCE: ffff9c8f5573d8e0 "WdFilter Instance" "328010"
      FLT_INSTANCE: ffff9c8f5577c8a0 "WdFilter Instance" "328010"
      FLT_INSTANCE: ffff9c8f5a3d38a0 "WdFilter Instance" "328010"
   FLT_FILTER: ffff9c8f627d1ba0 "storqosflt" "244000"
   FLT_FILTER: ffff9c8f5a6d7030 "wcifs" "189900"
      FLT_INSTANCE: ffff9c8f6add9010 "wcifs Outer Instance" "189899"
   FLT_FILTER: ffff9c8f62eee8a0 "CldFlt" "180451"
      FLT_INSTANCE: ffff9c8f557b8010 "CldFlt" "180451"
   FLT_FILTER: ffff9c8f628cbba0 "bfs" "150000"
      FLT_INSTANCE: ffff9c8f55734b00 "bfs" "150000"
      FLT_INSTANCE: ffff9c8f5a7e0ba0 "bfs" "150000"
      FLT_INSTANCE: ffff9c8f5a7e1ba0 "bfs" "150000"
      FLT_INSTANCE: ffff9c8f627ee8a0 "bfs" "150000"
      FLT_INSTANCE: ffff9c8f627ed8a0 "bfs" "150000"
      FLT_INSTANCE: ffff9c8f627ec8a0 "bfs" "150000"
      FLT_INSTANCE: ffff9c8f627eb8a0 "bfs" "150000"
      FLT_INSTANCE: ffff9c8f627ea8a0 "bfs" "150000"
      FLT_INSTANCE: ffff9c8f627e98a0 "bfs" "150000"
   FLT_FILTER: ffff9c8f550d4c60 "FileCrypt" "141100"
   FLT_FILTER: ffff9c8f5a85e010 "luafv" "135000"
      FLT_INSTANCE: ffff9c8f629cf010 "luafv" "135000"
   FLT_FILTER: ffff9c8f552e8c40 "npsvctrig" "46000"
      FLT_INSTANCE: ffff9c8f5516d8a0 "npsvctrig" "46000"
   FLT_FILTER: ffff9c8f53d38a00 "Wof" "40700"
      FLT_INSTANCE: ffff9c8f5510b8a0 "Wof Instance" "40700"
      FLT_INSTANCE: ffff9c8f5569f8a0 "Wof Instance" "40700"
      FLT_INSTANCE: ffff9c8f5572c8e0 "Wof Instance" "40700"
      FLT_INSTANCE: ffff9c8f5574a8a0 "Wof Instance" "40700"
   FLT_FILTER: ffff9c8f53d3b8a0 "FileInfo" "40500"
      FLT_INSTANCE: ffff9c8f53ea28a0 "FileInfo" "40500"
      FLT_INSTANCE: ffff9c8f550d58a0 "FileInfo" "40500"
      FLT_INSTANCE: ffff9c8f55364010 "FileInfo" "40500"
      FLT_INSTANCE: ffff9c8f556486e0 "FileInfo" "40500"
      FLT_INSTANCE: ffff9c8f556cd8a0 "FileInfo" "40500"
      FLT_INSTANCE: ffff9c8f557458a0 "FileInfo" "40500"
      FLT_INSTANCE: ffff9c8f5a3c9730 "FileInfo" "40500"
This command enumerates the frames in FLTMGR!FltGlobals, then enumerates the filters registered for each frame. We could recreate this with DX if we wanted to but for now the FltKd output is good enough.
Our next step is to find all the ports registered by a filter driver. We can use FltKd for this as well, with the fltkd.portlist command. For this exercise we’ll pick the Windows Defender filter driver, wdfilter:
!fltkd.portlist 0xffff9c8f53d3dab0
 FLT_FILTER: ffff9c8f53d3dab0    Client Port List         : Mutex (ffff9c8f53d3dd08) List [ffff9c8f6b6312f0-ffff9c8f6b633270] mCount=5
       FLT_PORT_OBJECT: ffff9c8f6b6312f0
          FilterLink               : [ffff9c8f6b630870-ffff9c8f53d3dd40]
          ServerPort               : ffff9c8f524f3420
          Cookie                   : ffff9c8f53d3e108
          Lock                     : (ffff9c8f6b631318)
          MsgQ                     : (ffff9c8f6b631350)  NumEntries=0 Enabled
          MessageId                : 0x0000000000000000
          DisconnectEvent          : (ffff9c8f6b631428)
          Disconnected             : FALSE
       FLT_PORT_OBJECT: ffff9c8f6b630870
          FilterLink               : [ffff9c8f6b634770-ffff9c8f6b6312f0]
          ServerPort               : ffff9c8f524f4550
          Cookie                   : ffff9c8f53d3e148
          Lock                     : (ffff9c8f6b630898)
          MsgQ                     : (ffff9c8f6b6308d0)  NumEntries=8 Enabled
          MessageId                : 0x0000000000000000
          DisconnectEvent          : (ffff9c8f6b6309a8)
          Disconnected             : FALSE
       FLT_PORT_OBJECT: ffff9c8f6b634770
          FilterLink               : [ffff9c8f6b634cb0-ffff9c8f6b630870]
          ServerPort               : ffff9c8f524f44a0
          Cookie                   : ffff9c8f53d3e138
          Lock                     : (ffff9c8f6b634798)
          MsgQ                     : (ffff9c8f6b6347d0)  NumEntries=16 Enabled
          MessageId                : 0x0000000000000000
          DisconnectEvent          : (ffff9c8f6b6348a8)
          Disconnected             : FALSE
       FLT_PORT_OBJECT: ffff9c8f6b634cb0
          FilterLink               : [ffff9c8f6b633270-ffff9c8f6b634770]
          ServerPort               : ffff9c8f524f3840
          Cookie                   : ffff9c8f53d3e118
          Lock                     : (ffff9c8f6b634cd8)
          MsgQ                     : (ffff9c8f6b634d10)  NumEntries=16 Enabled
          MessageId                : 0x000000000000a3c1
          DisconnectEvent          : (ffff9c8f6b634de8)
          Disconnected             : FALSE
       FLT_PORT_OBJECT: ffff9c8f6b633270
          FilterLink               : [ffff9c8f53d3dd40-ffff9c8f6b634cb0]
          ServerPort               : ffff9c8f524f3e70
          Cookie                   : ffff9c8f53d3e128
          Lock                     : (ffff9c8f6b633298)
          MsgQ                     : (ffff9c8f6b6332d0)  NumEntries=2 Enabled
          MessageId                : 0x0000000000001e98
          DisconnectEvent          : (ffff9c8f6b6333a8)
          Disconnected             : FALSE
Great, we found five ports created by wdfilter! However, in this case, we probably do want to try and get this information with a DX command and not settle for the legacy extension output. That’s because the output of legacy extension commands can’t be enumerated or operated on and there’s no legacy command that answers our second question. This means that to find the connected process we’d have to operate on each port separately, resulting in a lot of manual steps. If we want to automate the process, we should get this information with the debugger data model and save the ports in a variable that we can use for our other commands.
Each filter driver is managed through a FLT_FILTER structure. This structure contains all the management information for the filter, including the list of all its communication ports, linked in its PortList field. The data for each port is saved in a FLT_PORT_OBJECT structure. Conveniently, we got the addresses of the FLT_FILTER structures for all the registered filters from our earlier command – !fltkd.filters. So let’s take the address of the wdfilter FLT_FILTER structure, and use DX to parse the port list. To make this easier to use later, I’ll create a helper function to do this, and also save the wdfilter address in a variable:
dx @$enumPortsForFilter = (filter => Debugger.Utility.Collections.FromListEntry(((fltmgr!_FLT_FILTER*)filter)->PortList.mList, "fltmgr!_FLT_PORT_OBJECT", "FilterLink"))
dx @$wdfilter = 0xffff9c8f53d3dab0
Now we can call the function and get all the ports registered by the driver, and save them in a variable that we will use in the rest of the post:
dx @$wdfilterports = @$enumPortsForFilter(@$wdfilter)
@$wdfilterports = @$enumPortsForFilter(@$wdfilter)
[0x0] [Type: _FLT_PORT_OBJECT]
[0x1] [Type: _FLT_PORT_OBJECT]
[0x2] [Type: _FLT_PORT_OBJECT]
[0x3] [Type: _FLT_PORT_OBJECT]
[0x4] [Type: _FLT_PORT_OBJECT]
Before we get to the second part of the question and try to find the processes using each port, there’s one more piece of information we might want to find about each port: its name. To do that, we need to look at the port structure itself, since the communication ports we retrieved aren’t named, as we can see with the !object command:
dx -r0 &@$wdfilterports.First()
&@$wdfilterports.First() : 0xffff9c8f6b6312f0 [Type: _FLT_PORT_OBJECT *]
!object 0xffff9c8f6b6312f0
Object: ffff9c8f6b6312f0 Type: (ffff9c8f4f0f5f00) FilterCommunicationPort
ObjectHeader: ffff9c8f6b6312c0 (new version)
HandleCount: 1 PointerCount: 3
Instead, we need to look at the ServerPort field of the FLT_PORT_OBJECT, which points to a connection port object that represents the driver’s connection to the port:
dx -r0 @$wdfilterports.First().ServerPort
@$wdfilterports.First().ServerPort : 0xffff9c8f524f3420 [Type: _FLT_SERVER_PORT_OBJECT *]
!object 0xffff9c8f524f3420
Object: ffff9c8f524f3420 Type: (ffff9c8f4f0f5400) FilterConnectionPort
ObjectHeader: ffff9c8f524f33f0 (new version)
HandleCount: 1 PointerCount: 3
Directory Object: ffffd584ae22c930 Name: MicrosoftMalwareProtectionControlPortWD
Now we found the port’s name – MicrosoftMalwareProtectionControlPortWD. We can run !object on the server port for each of the communication ports and find the name for all of them as well. This can be automated with dx and the ExecuteCommand routine, but if you are running a modern build of WinDbg you can just find the object header of the connection port and access the ObjectName field to retrieve the name. This field isn’t actually a part of the OBJECT_HEADER structure, but in modern builds the debugger data model parses the name and adds it as a synthetic field. Unfortunately, the debugger data model doesn’t supply us with an easy way to get the address of the header for a given object and hard-coding offsets isn’t ideal, so we’ll use the C++ #FIELD_OFFSET macro to save the offset in a register and use it in our DX command. Then we can quickly get the name for each port created by wdfilter:
r? @$t1 = #FIELD_OFFSET(nt!_OBJECT_HEADER, Body)
dx @$wdfilterports.Select(p => ((nt!_OBJECT_HEADER*)((__int64)p.ServerPort - @$t1))->ObjectName)
@$wdfilterports.Select(p => ((nt!_OBJECT_HEADER*)((__int64)p.ServerPort - @$t1))->ObjectName)
[0x0] : "MicrosoftMalwareProtectionControlPortWD"
[0x1] : "MicrosoftMalwareProtectionAsyncPortWD"
[0x2] : "MicrosoftMalwareProtectionRemoteIoPortWD"
[0x3] : "MicrosoftMalwareProtectionPortWD"
[0x4] : "MicrosoftMalwareProtectionVeryLowIoPortWD"
If you are using an older build of WinDbg you may not have the ObjectName field automatically added and need to parse it yourselves. The process of doing that is a bit ugly and also not the topic of this post so I’ll skip this step and just recommend that you use the latest version of the debugger.
Alternatively, we could have skipped this whole part of the post and use the search function of WinObjEx to search for all FilterConnectionPort objects and look at each individual one to find which driver created it:

But tools like WinObjEx aren’t always available (for example, when you analyze a crash dump and don’t have access to the live machine) and besides, we can only answer the second part of the question using a kernel debugger. So, let’s try to find out who is connected to all these ports.
Finding the Connected Process
The first step when finding the connected processes is to check if there are any connected processes at all. This information is easy to find, we just need to look at the NumberOfConnections field of the server connection port:
dx @$wdfilterports.Select(p => p.ServerPort->NumberOfConnections)
@$wdfilterports.Select(p => p.ServerPort->NumberOfConnections)
[0x0] : 1 [Type: long]
[0x1] : 1 [Type: long]
[0x2] : 1 [Type: long]
[0x3] : 1 [Type: long]
[0x4] : 1 [Type: long]
Looks like all the Windows Defender ports have one process connected to them (and if you look at the MaxConnections field you’ll see that’s the most each of them can have). But how can we find out which process that is? Unfortunately, the connected process isn’t linked to the port itself, or, in fact, saved anywhere. So, there is no easy way to find the information we’re looking for. But obviously the system must have a way to link the connected process to the port in order to pass messages between the driver and the process, so let’s follow the trails.
To connect to a communication port, a process needs to call FilterConnectCommunicationPort. It receives a handle to the port, which it can use to send or receive messages. This handle is not a handle to a FilterConnectionPort object, but rather to a file object. As James Forshaw explains in this excellent Project Zero blog post:
In FltCreateCommunicationPort the filter manager creates a new named kernel object of type FilterConnectionPort with the OBJECT_ATTRIBUTES and associates it with the callbacks. There’s no NtOpenFilterConnectionPort system call to open a port. Instead when a user wants to access the port it must first open a handle to the filter manager message device object, \FileSystem\Filters\FltMgrMsg, passing an extended attributes structure identifying the full OMNS path to the port.
It is much easier to open a port by calling the
FilterConnectCommunicationPortAPI in user-mode, so you don’t need to deal with connecting manually. When opening a port you can also specify an arbitrary context buffer to pass to the connect callback. This can be used to configure the open port instance. On connection the connect notification callback passed toFltCreateCommunicationPortwill be called.
Every opened handle to a communication port is linked to the device \FileSystem\Filters\FltMgrMsg, so we could search for all handles to this device and find the processes that interact with communication ports. We can start by using the search function of System Informer:
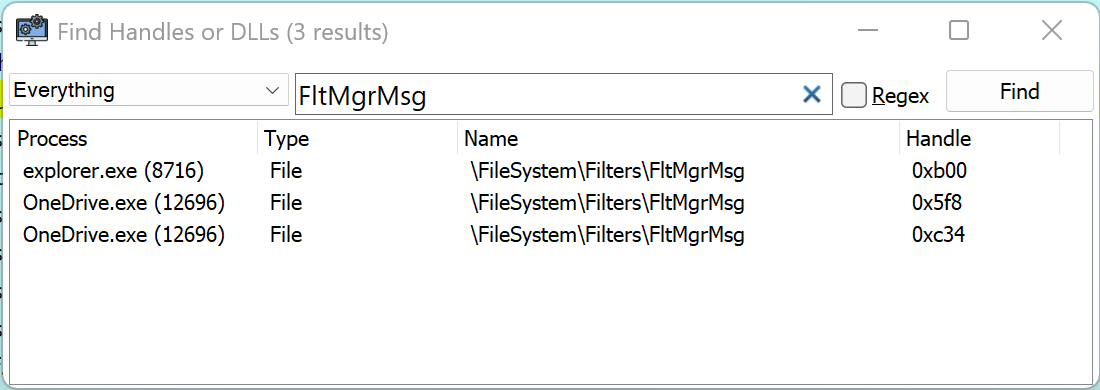
This is a good start, but this still isn’t giving us the full picture. First, we don’t necessarily see the handles for every process, since I’m running System Informer without loading its driver, so it doesn’t have visibility into protected processes. Also, this also doesn’t tell us which port (or ports) each process is connected to. But with this knowledge we can go back into the debugger and hunt for handles to this device, then see how we can find the connection back to the port itself.
In the debugger, we can’t just search for handles to the device itself since each new connection receives a handle to a unique file object which points to the device. Unfortunately, these file objects aren’t named, making them a bit more complicated to search for (don’t be confused by the System Informer results, there is a lot going on behind the scenes there to get the correct name for each file). However, these FILE_OBJECTs have a DeviceObject field that should point to the FltMgrMsg device. Getting the address of the device is easy – we can just use the !object command to search for it by name:
!object \FileSystem\Filters\FltMgrMsg
Object: ffff9c8f518ec960 Type: (ffff9c8f4ef646c0) Device
ObjectHeader: ffff9c8f518ec930 (new version)
HandleCount: 0 PointerCount: 2
Directory Object: ffffd584aec0f3e0 Name: FltMgrMsg
For convenience, I’ll save the object’s address in a variable:
dx @$fltmgrmsg = 0xffff9c8f518ec960
And write a helper function to search for file objects pointing to this device in a process’ handle table:
dx @$fltmgrmsgHandles = (p => p.Io.Handles.Where(h => h.Type == "File" && h.Object.UnderlyingObject.DeviceObject == @$fltmgrmsg))
Just to test it out, I’ll give it the OneDrive.exe process that we’ve seen in System Informer, since we already know it should have open handles to this device:
dx -r2 @$fltmgrmsgHandles(@$cursession.Processes[12696])
@$fltmgrmsgHandles(@$cursession.Processes[12696])
[0x5f8]
Handle : 0x5f8
Type : File
GrantedAccess : Synch | Read/List | Write/Add
Object [Type: _OBJECT_HEADER]
    [0xc34]</code

        Handle           : 0xc34

        Type             : File

        GrantedAccess    : Synch | Read/List | Write/Add

        Object           [Type: _OBJECT_HEADER]
We got two results, the same ones we saw in System Informer! Now, how do we get from here to the ports themselves? To link between a file handle and the related port we need to look at the underlying FILE_OBJECT and its FsContext2 field, which point to the CCB, or the Context Control Block. This field contains additional information about the file object, including a Port field:
dx ((fltmgr!_FLT_CCB*)(@$fltmgrmsgHandles(@$cursession.Processes[12696]).First().Object.UnderlyingObject.FsContext2))->Data
((fltmgr!_FLT_CCB*)(@$fltmgrmsgHandles(@$cursession.Processes[12696]).First().Object.UnderlyingObject.FsContext2))->Data [Type: <unnamed-tag>]
[+0x000] Manager [Type: _MANAGER_CCB]
[+0x000] Filter [Type: _FILTER_CCB]
[+0x000] Instance [Type: _INSTANCE_CCB]
[+0x000] Volume [Type: _VOLUME_CCB]
[+0x000] Port [Type: _PORT_CCB]
In the Port field we can find a pointer to a communication port:
dx ((fltmgr!_FLT_CCB*)(@$fltmgrmsgHandles(@$cursession.Processes[12696]).First().Object.UnderlyingObject.FsContext2))->Data.Port
((fltmgr!_FLT_CCB*)(@$fltmgrmsgHandles(@$cursession.Processes[12696]).First().Object.UnderlyingObject.FsContext2))->Data.Port [Type: _PORT_CCB]
[+0x000] Port : 0xffff9c8f6b6433b0 [Type: _FLT_PORT_OBJECT *]
[+0x008] ReplyWaiterList [Type: _FLT_MUTEX_LIST_HEAD]
And once again, if we grab the ServerPort from the communication port, we can find the port name:
dx -r0 ((fltmgr!_FLT_CCB*)(@$fltmgrmsgHandles(@$cursession.Processes[12696]).First().Object.UnderlyingObject.FsContext2))->Data.Port.Port->ServerPort
((fltmgr!_FLT_CCB*)(@$fltmgrmsgHandles(@$cursession.Processes[12696]).First().Object.UnderlyingObject.FsContext2))->Data.Port.Port->ServerPort : 0xffff9c8f5b1afa20 [Type: _FLT_SERVER_PORT_OBJECT *]
!object 0xffff9c8f5b1afa20
Object: ffff9c8f5b1afa20 Type: (ffff9c8f4f0f5400) FilterConnectionPort
ObjectHeader: ffff9c8f5b1af9f0 (new version)
HandleCount: 1 PointerCount: 5
Directory Object: ffffd584ae22c930 Name: CLDMSGPORT
We now know how to get from a file handle to the name of the communication port, so we can follow the same path for all processes that opened handles to communication ports. We can implement that as debugger data model queries in WinDbg, but scanning all the handle tables for all processes is a bit slow, so I wrote the same logic in JavaScript:
function initializeScript()
{
return [new host.functionAlias(GetFileHandlesToDevice, "DeviceFileHandles"),
new host.apiVersionSupport(1, 6)];
}
function GetFileHandlesToDevice(Device)
{
// Get easy access to the debug output method
let dbgOutput = host.diagnostics.debugLog;
// Loop over each process
let processes = host.currentSession.Processes;
let objHeaderType = host.getModuleType("nt", "_OBJECT_HEADER");
let objHeaderOffset = objHeaderType.fields.Body.offset;
for (let process of processes)
{
let handles = process.Io.Handles;
try {
for (let handle of handles) {
try {
let fileObj = handle.Object.ObjectType;
if (fileObj === "File") {
if (host.parseInt64(handle.Object.UnderlyingObject.DeviceObject.address, 16).compareTo(Device) == 0)
{
let fscontext2 = handle.Object.UnderlyingObject.FsContext2.address;
let fltCcbType = host.getModuleType("FltMgr", "_FLT_CCB");
let port = host.createTypedObject(fscontext2, fltCcbType).Data.Port.Port;
let portObjHeader = host.createTypedObject(port.ServerPort.address.subtract(objHeaderOffset), objHeaderType);
dbgOutput("\tProcess ", process.Name, " has handle ", handle.Handle, " to port ", portObjHeader.ObjectName, "\n");
}
}
} catch (e) {
dbgOutput("\tException parsing handle ", handle.Handle, "in process ", process.Name, "!\n");
}
}
} catch (e) {
dbgOutput("\tException parsing handle table for process ", process.Name, " PID ", process.Id, "!\n");
}
}
}
Running the script, we can find the handles to communication ports:
dx @$scriptContents.GetHandlesToDevice(@$fltmgrmsg)
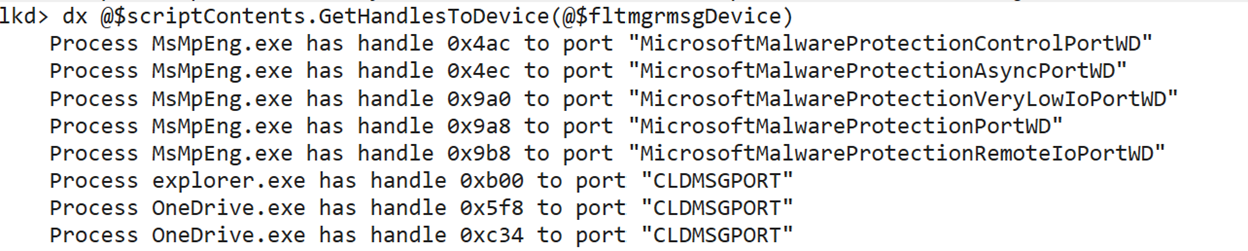
We see here the three handles we saw in System Informer (all to the CLDMSGPORT port) and some handles that System Informer didn’t show us since they belong to MsMpEng.exe – the user-mode process belonging to Windows Defender, running as a PPL. Those five handles match the five ports created by wdfilter.
What Else Can We Learn About the Port?
At this point, we have a few pieces of information about each communication port in the system:
- The port’s name
- The driver that created the port
- The user-mode process or processes that are connected to the port
But we’re not done yet – these ports contain some more information that can tell us a little bit about how they are used. Every port can be used to send messages from the process to the driver or from the driver to the process, or both. Some ports are only used for unidirectional communication, and others are used in both directions. Knowing the direction of a port could help us tell if a port is used to send requests or commands to the driver, or to send information to the user-mode process (for example to pass data collected by the driver that should be sent to a server by the process).
Knowing if the driver expects to receive messages from the process is relatively easy – on port creation the driver can register a MessageNotifyCallback routine that will get called when a message is sent from the connected process. Registering this callback is optional, and if no callback is registered, the driver can’t receive any messages.
So, let’s get back to the wdfilterports variable that we created in the beginning of the post and, once again, look at all the ports registered by wdfilter. For each one, we’ll print the MessageNotify field of the server port and see if one is registered. Let’s also print the name of each port, so we can easily identify them:
r? @$t1 = #FIELD_OFFSET(nt!_OBJECT_HEADER, Body)
dx -g @$wdfilterports.Select(p => new {Name = ((nt!_OBJECT_HEADER*)((__int64)p.ServerPort - @$t1))->ObjectName, MessageNotify = p.ServerPort->MessageNotify})
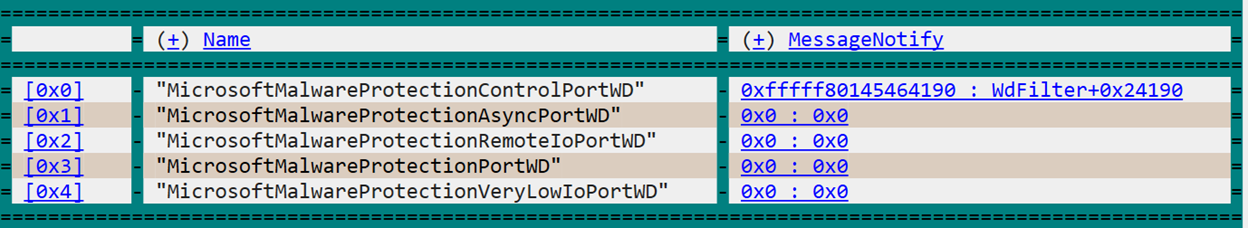
Looks like out of the five registered ports, only one is configured to receive messages: MicrosoftMalwareProtectionControlPortWD. All the other ports seem to be informational ports, where communication only flows from the driver to the process. But MicrosoftMalwareProtectionControlPortWD might also send information to the user-mode process, we can’t know for sure. Yet.
To find out if anyone is expecting to receive messages from a communication port, we need to look at wait queues.
Every port has a message queue that allows threads to wait for new messages from the driver. This means that if we enumerate that wait queue, we can find out which ports have waiters that expect to receive messages. This doesn’t necessarily mean that the driver plans to send messages, but in most cases we can assume that someone waiting on the port means that messages will be sent from the driver at some point. Knowing which thread is waiting on a port can sometimes be helpful, but if it’s a worker thread (in case this is an asynchronous wait) it may not be.
If we look at the wait queue of a port, what we’ll find is a list of IRPs. These IRPs will be completed when a message is sent that fits the requirements of the waiting thread. The waiting thread will then be alerted and process the message. Usually, the processing thread calls FilterGetMessage in a loop, so after it finishes processing a message it will get right back into the wait queue.
To parse the wait queues, we go back to our list of ports and look at the MsgQ field. This is our message queue, which contains a WaiterQ field, that holds the list of pending IRPs:
dx -r2 @$wdfilterports.Select(p => p.MsgQ.WaiterQ)
@$wdfilterports.Select(p => p.MsgQ.WaiterQ)
     [0x0]            [Type: _FLT_MUTEX_LIST_HEAD]
         [+0x000] mLock            [Type: _FAST_MUTEX]
         [+0x038] mList            [Type: _LIST_ENTRY]
         [+0x048] mCount           : 0x0 [Type: unsigned long]
         [+0x048 ( 0: 0)] mInvalid         : 0x0 [Type: unsigned char]
     [0x1]            [Type: _FLT_MUTEX_LIST_HEAD]
         [+0x000] mLock            [Type: _FAST_MUTEX]
         [+0x038] mList            [Type: _LIST_ENTRY]
         [+0x048] mCount           : 0x10 [Type: unsigned long]
         [+0x048 ( 0: 0)] mInvalid         : 0x0 [Type: unsigned char]
     [0x2]            [Type: _FLT_MUTEX_LIST_HEAD]
         [+0x000] mLock            [Type: _FAST_MUTEX]
         [+0x038] mList            [Type: _LIST_ENTRY]
         [+0x048] mCount           : 0x20 [Type: unsigned long]
         [+0x048 ( 0: 0)] mInvalid         : 0x0 [Type: unsigned char]
     [0x3]            [Type: _FLT_MUTEX_LIST_HEAD]
         [+0x000] mLock            [Type: _FAST_MUTEX]
         [+0x038] mList            [Type: _LIST_ENTRY]
         [+0x048] mCount           : 0x20 [Type: unsigned long]
         [+0x048 ( 0: 0)] mInvalid         : 0x0 [Type: unsigned char]
     [0x4]            [Type: _FLT_MUTEX_LIST_HEAD]
         [+0x000] mLock            [Type: _FAST_MUTEX]
         [+0x038] mList            [Type: _LIST_ENTRY]
         [+0x048] mCount           : 0x4 [Type: unsigned long]
         [+0x048 ( 0: 0)] mInvalid         : 0x0 [Type: unsigned char]
The first (potentially) useful piece of information we can see here is mCount, telling us how many waiters are in the queue. The first port, MicrosoftMalwareProtectionControlPortWD, has an empty wait queue, meaning that no one is expecting to receive any messages from it. That probably means that this port is only used to send messages from the process to the driver (and at most receive an immediate reply, that doesn’t require any waiting), so the process has nothing to wait for. The other four ports do have several waiters expecting messages, so let’s see if we can find out the identity of these threads.
We start by parsing the list of IRPs linked in Port->MsgQ.WaiterQ.mList. This list links the IRPs through their Tail.Overlay.ListEntry field, and we can use DX to parse it. For anyone (like me) getting confused by all the structures, this diagram shows how all these data structures fit together:
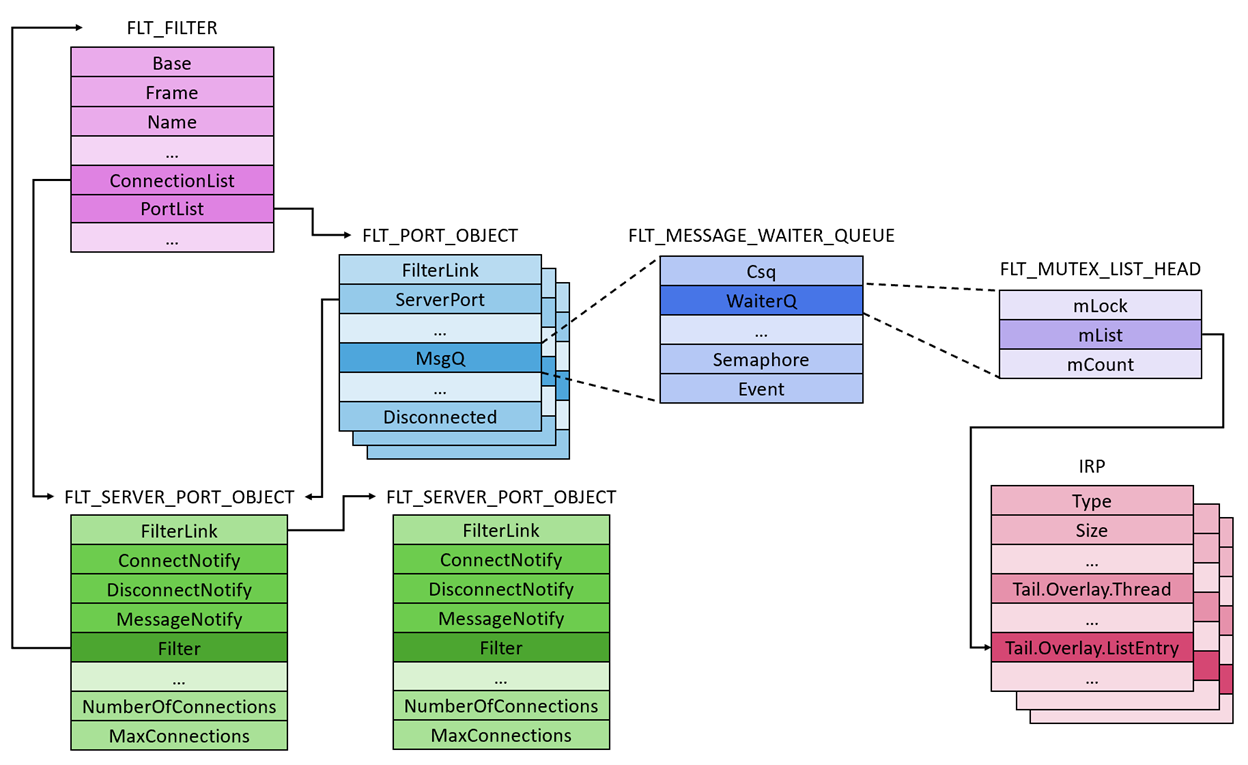
And now we can write a helper function to parse the list of queued IRPs:
dx @$getIrpList = (port => Debugger.Utility.Collections.FromListEntry(((fltmgr!_FLT_PORT_OBJECT*)port)->MsgQ.WaiterQ.mList, "nt!_IRP", "Tail.Overlay.ListEntry"))
Now let’s call @$getIrpList for each port in the list and grab the thread address for every IRP. We can find that in Irp.Tail.Overlay.Thread, or just use Irp->CurrentThread, since the debugger data model adds a synthetic field for our convenience:
dx -r2 @$wdfilterports.Select(p => @$getIrpList(&p).Select(i => i->CurrentThread))
@$ports.Select(p => @$getIrpList(&p).Select(i => i->CurrentThread))
    [0x0]
    [0x1]
        [0x0]            : 0xffffc685acdb6080 [Type: _ETHREAD *]
        [0x1]            : 0xffffc685acdb6080 [Type: _ETHREAD *]
        [0x2]            : 0xffffc685acdb6080 [Type: _ETHREAD *]
        [0x3]            : 0xffffc685acdb6080 [Type: _ETHREAD *]
        [0x4]            : 0xffffc685acdb6080 [Type: _ETHREAD *]
        [0x5]            : 0xffffc685acdb6080 [Type: _ETHREAD *]
        [0x6]            : 0xffffc685acdb6080 [Type: _ETHREAD *]
        [0x7]            : 0xffffc685acdb6080 [Type: _ETHREAD *]
    [0x2]
        [0x0]            : 0xffffc685af203080 [Type: _ETHREAD *]
        [0x1]            : 0xffffc685af203080 [Type: _ETHREAD *]
        [0x2]            : 0xffffc685af203080 [Type: _ETHREAD *]
        [0x3]            : 0xffffc685af203080 [Type: _ETHREAD *]
        [0x4]            : 0xffffc685af203080 [Type: _ETHREAD *]
        [0x5]            : 0xffffc685af203080 [Type: _ETHREAD *]
        [0x6]            : 0xffffc685af203080 [Type: _ETHREAD *]
        [0x7]            : 0xffffc685af203080 [Type: _ETHREAD *]
        [0x8]            : 0xffffc685af203080 [Type: _ETHREAD *]
        [0x9]            : 0xffffc685af203080 [Type: _ETHREAD *]
        [0xa]            : 0xffffc685af203080 [Type: _ETHREAD *]
        [0xb]            : 0xffffc685af203080 [Type: _ETHREAD *]
        [0xc]            : 0xffffc685af203080 [Type: _ETHREAD *]
        [0xd]            : 0xffffc685af203080 [Type: _ETHREAD *]
        [0xe]            : 0xffffc685af203080 [Type: _ETHREAD *]
        [0xf]            : 0xffffc685af203080 [Type: _ETHREAD *]
    [0x3]
        [0x0]            : 0xffffc685aae61080 [Type: _ETHREAD *]
        [0x1]            : 0xffffc685aae61080 [Type: _ETHREAD *]
        [0x2]            : 0xffffc685aae61080 [Type: _ETHREAD *]
        [0x3]            : 0xffffc685aae61080 [Type: _ETHREAD *]
        [0x4]            : 0xffffc685aae61080 [Type: _ETHREAD *]
        [0x5]            : 0xffffc685aae61080 [Type: _ETHREAD *]
        [0x6]            : 0xffffc685aae61080 [Type: _ETHREAD *]
        [0x7]            : 0xffffc685aae61080 [Type: _ETHREAD *]
        [0x8]            : 0xffffc685aae61080 [Type: _ETHREAD *]
        [0x9]            : 0xffffc685aae61080 [Type: _ETHREAD *]
        [0xa]            : 0xffffc685aae61080 [Type: _ETHREAD *]
        [0xb]            : 0xffffc685aae61080 [Type: _ETHREAD *]
        [0xc]            : 0xffffc685aae61080 [Type: _ETHREAD *]
        [0xd]            : 0xffffc685aae61080 [Type: _ETHREAD *]
        [0xe]            : 0xffffc685aae61080 [Type: _ETHREAD *]
        [0xf]            : 0xffffc685aae61080 [Type: _ETHREAD *]
    [0x4]
        [0x0]            : 0xffffc685ada78080 [Type: _ETHREAD *]
        [0x1]            : 0xffffc685b0668080 [Type: _ETHREAD *]
It looks like we have a lot of duplicates here. This is normal, as the same thread might appear in multiple IRPs. Since we don’t care about each individual IRP, and only care about the threads themselves, we can clean up our view using the Distinct() method and get the thread ID for each thread. And then clean up our view even more by using SelectMany to flatten the array:
dx @$wdfilterports.SelectMany(p => @$getIrpList(&p).Select(i => i->CurrentThread).Distinct().Select(t => t->Cid.UniqueThread))
@$wdfilterports.SelectMany(p => @$getIrpList(&p).Select(i => i->CurrentThread).Distinct().Select(t => t->Cid.UniqueThread))
    [0x0]            : 0x31c4 [Type: void *]
    [0x1]            : 0x13a8 [Type: void *]
    [0x2]            : 0xc84 [Type: void *]
    [0x3]            : 0xcb8 [Type: void *]
We can also get the process ID to know which process hosts these threads, but we already know that the only process that’s connected to the Windows Defender ports is MsMpEng.exe so there’s no need. Finally, let’s put everything together and add the port name and message notify routine:
r? @$t1 = #FIELD_OFFSET(nt!_OBJECT_HEADER, Body)
dx -g @$wdfilterports.Select(p => new {Name = ((nt!_OBJECT_HEADER*)((__int64)p.ServerPort - @$t1))->ObjectName, MessageNotify = p.ServerPort->MessageNotify, ListeningThreads = @$getIrpList(&p).Select(i => i->CurrentThread).Distinct().Count()})
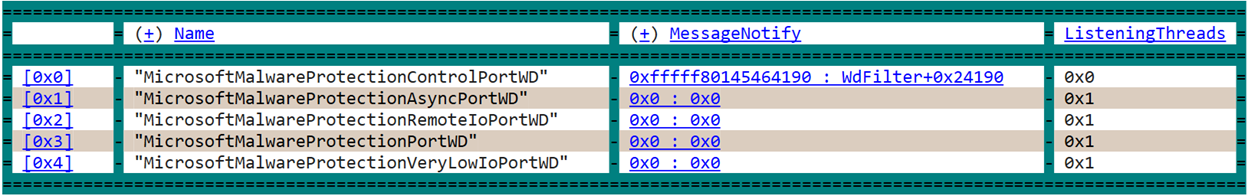
There we have it. The first port is used to send messages to the driver, and the other four are used to send information back to the process. You can use these queries to find the thread IDs, analyze the call stacks and find the user-mode message handlers of each of the ports. This is especially cool when analyzing a crash dump of a suspicious machine, where there aren’t any tools to help us except the debugger.
Hope this post has been useful to at least some of you, and I hope to see more memory forensic scripts and methods in the future!
- Random Windows Things Part 2: Unexpected Clipboard Data Behavior
- Random Windows Things Part 1: PreviousMode Mitigation
- Goodbye Secure Pool, Hello KDP Pool
- Secure Kernel Research with LiveCloudKd
- Troubleshooting a System Crash
- KASLR Leaks Restriction
- Investigating Filter Communication Ports
- An End to KASLR Bypasses?
- Understanding a New Mitigation: Module Tampering Protection
- One I/O Ring to Rule Them All: A Full Read/Write Exploit Primitive on Windows 11