
Analyzing the PayloadRestrictions.dll Export Address Filtering
This post is a bit different from my usual ones. It won’t cover any new security features or techniques and won’t share any novel security research. Instead, it will guide you through the process of analyzing an unknown mitigation through a real-life example in Windows Defender Exploit Guard (formerly EMET). Because the goal here is to show a step-by-step, real life research process, the post will be a bit disorganized and will follow a more organic and messy train of thought.
A brief explanations of the Windows Defender Exploit Guard: formerly known as EMET, this is a DLL that gets injected on demand and implements several security mitigations such as Export Address Filtering, Import Address Filtering, Stack Integrity Validations, and more. These are all disabled by default and need to be manually enabled in the Windows security settings, either for a specific process or for the whole system. Since it was acquired by Microsoft, these mitigations are implemented in PayloadRestrictions.dll, which can be found in C:\Windows\System32.
This post will follow one of these mitigations, named Export Address Filtering (or EAF). This tutorial will demonstrate a step-by-step guide for analyzing this mitigation, using both dynamic analysis in WinDbg and static analysis in IDA and Hex Rays. I’ll try to highlight the things that should be focused on when analyzing a mitigation and show that even with partial information we can reach useful conclusions and learn about this feature.
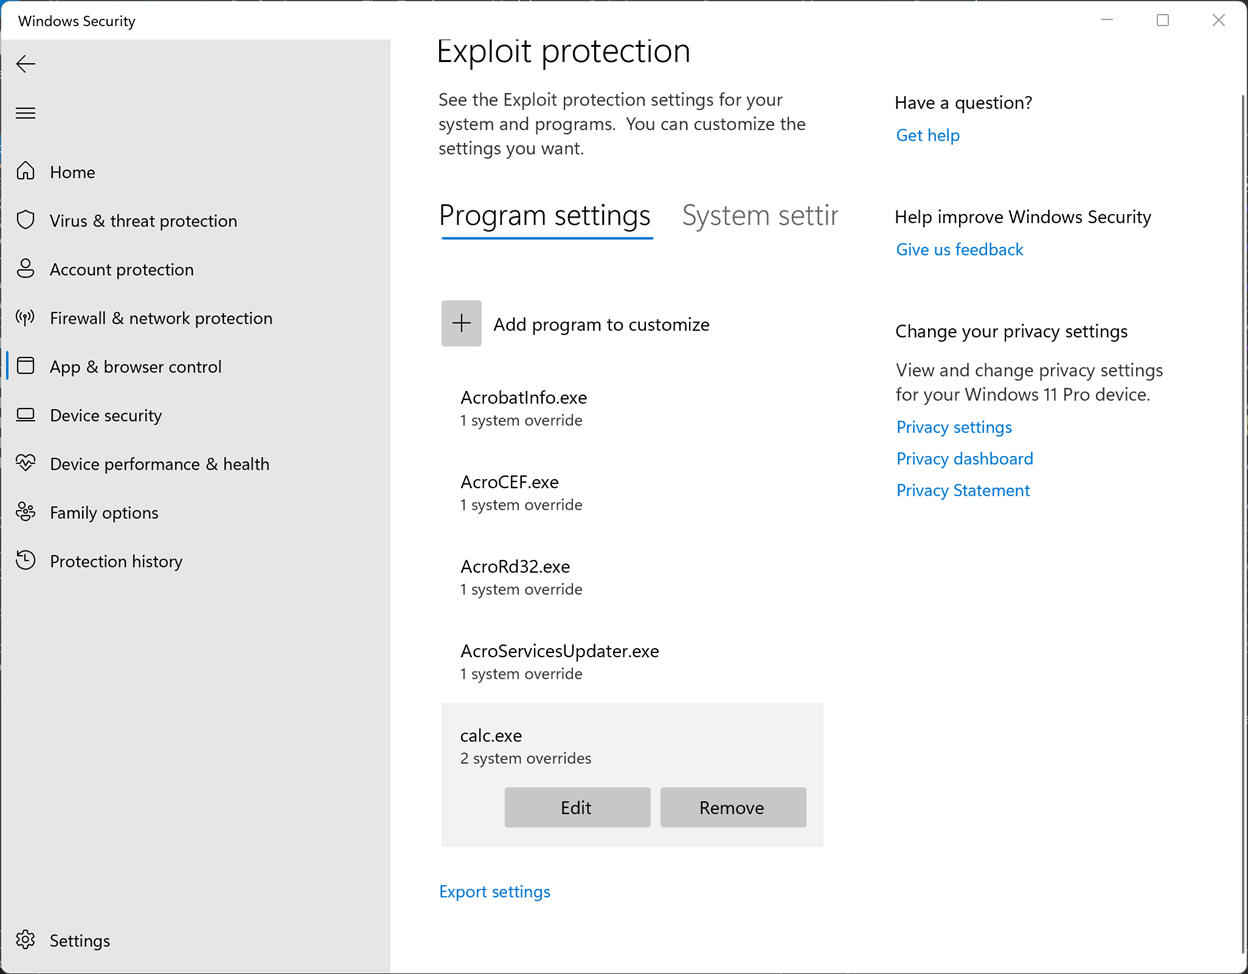
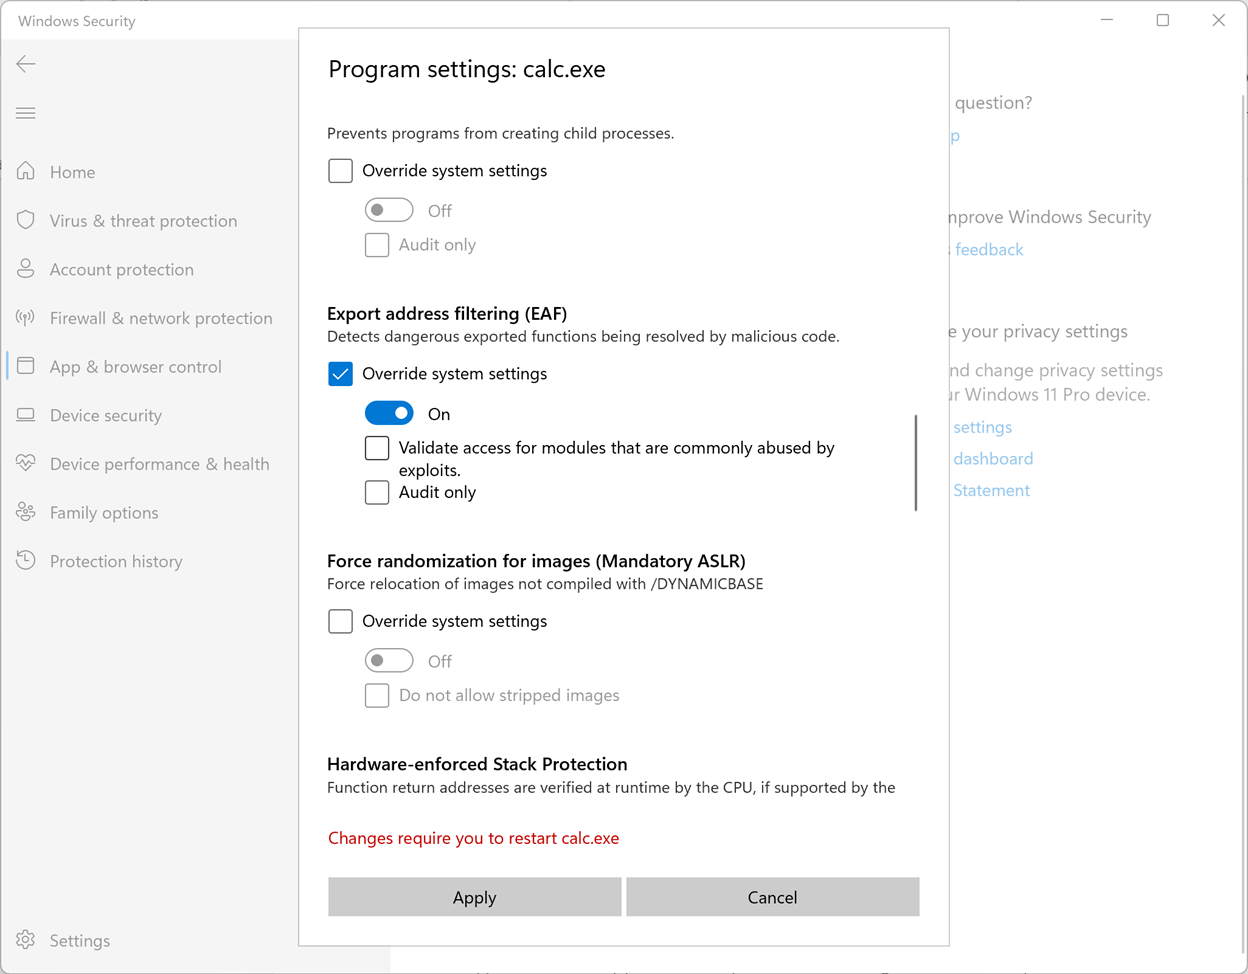
First, we’ll enable EAF in calc.exe in the Windows Security settings:
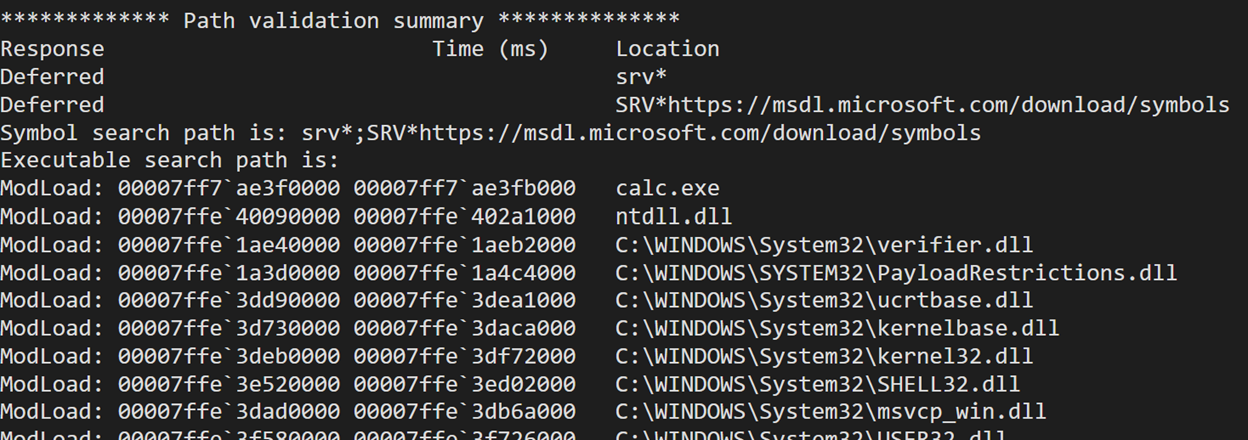
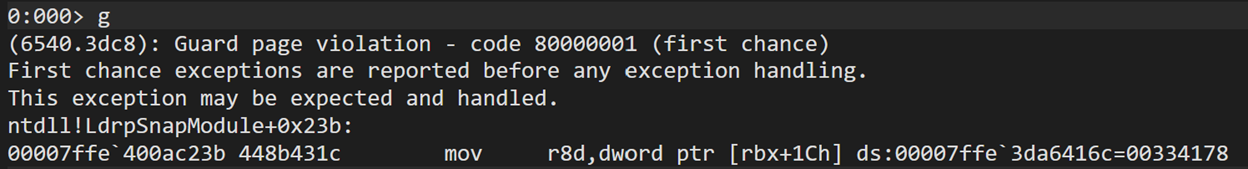
We don’t know anything about this mitigation yet other than that one line descriptions in the security settings, so we’ll start by running calc.exe under a debugger to see what happens. Immediately we can see PayloadRestrictions.dll get loaded into the process:
And almost right away we get a guard page violation:
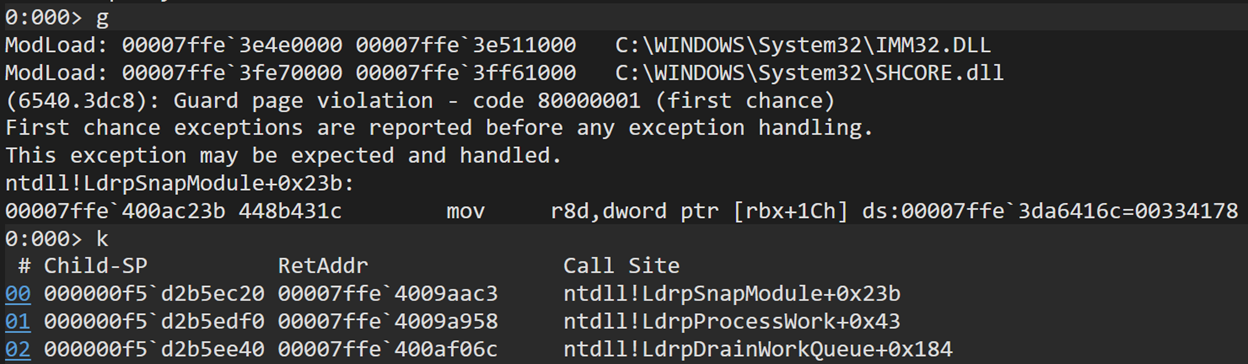
What is in this mysterious address and why does accessing it throw a guard page violation?
To start finding out the answer to the first question we can run !address to get a few more details about the address causing the exception:
!address 00007ffe`3da6416c

Usage:                  Image
Base Address:           00007ffe`3d8b9000
End Address:            00007ffe`3da7a000
Region Size:            00000000`001c1000 (   1.754 MB)
State:                  00001000          MEM_COMMIT
Protect:                00000002          PAGE_READONLY
Type:                   01000000          MEM_IMAGE
Allocation Base:        00007ffe`3d730000
Allocation Protect:     00000080          PAGE_EXECUTE_WRITECOPY
Image Path:             C:\WINDOWS\System32\kernelbase.dll
Module Name:            kernelbase
Loaded Image Name:
Mapped Image Name:
More info:              lmv m kernelbase
More info:              !lmi kernelbase
More info:              ln 0x7ffe3da6416c
More info:              !dh 0x7ffe3d730000


Content source: 1 (target), length: 15e94
Now we know that this address is in a read-only page inside KernelBase.dll. But we don’t have any information that will help us understand what this page is and why it’s guarded. Let’s follow the suggestion of the command output and run !dh to dump the headers of KernelBase.dll to get some more information (showing partial output here since full output is very long):
!dh 0x7ffe3d730000

File Type: DLL
FILE HEADER VALUES
8664 machine (X64)
7 number of sections
FE317FB0 time date stamp Sat Feb 21 05:53:36 2105

0 file pointer to symbol table
0 number of symbols
F0 size of optional header
2022 characteristics
Executable
App can handle >2gb addresses
DLL

OPTIONAL HEADER VALUES
20B magic #
14.30 linker version
188000 size of code
211000 size of initialized data
0 size of uninitialized data
89FE0 address of entry point
1000 base of code
----- new -----
00007ffe3d730000 image base
1000 section alignment
1000 file alignment
3 subsystem (Windows CUI)
10.00 operating system version
10.00 image version
10.00 subsystem version
39A000 size of image
1000 size of headers
3A8E61 checksum
0000000000040000 size of stack reserve
0000000000001000 size of stack commit
0000000000100000 size of heap reserve
0000000000001000 size of heap commit
4160 DLL characteristics
High entropy VA supported
Dynamic base
NX compatible
Guard
334150 [ F884] address [size] of Export Directory
3439D4 [ 50] address [size] of Import Directory
369000 [ 548] address [size] of Resource Directory
34F000 [ 18828] address [size] of Exception Directory
397000 [ 92D0] address [size] of Security Directory
36A000 [ 2F568] address [size] of Base Relocation Directory
29B8C4 [ 70] address [size] of Debug Directory
0 [ 0] address [size] of Description Directory
0 [ 0] address [size] of Special Directory
255C20 [ 28] address [size] of Thread Storage Directory
1FB6D0 [ 140] address [size] of Load Configuration Directory
0 [ 0] address [size] of Bound Import Directory
2569D8 [ 16E0] address [size] of Import Address Table Directory
331280 [ 620] address [size] of Delay Import Directory
0 [ 0] address [size] of COR20 Header Directory
0 [ 0] address [size] of Reserved Directory
Our faulting address is 0x7ffe3da6416c, which is at offset 0x33416c inside KernelBase.dll. Looking for the closest match in the output of !dh we can find the export directory at offset 0x334150:
334150 [ F884] address [size] of Export Directory
So the faulting code is trying to access an entry in the KernelBase export table. That shouldn’t happen under normal circumstances – if you debug another process (one that doesn’t have EAF enabled) you will not see any exceptions being thrown when accessing the export table. So we can guess that PayloadRestrictions.dll is causing this, and we’ll soon see how and why it does it.
One thing to note about guard page violations is this, quoted from this MSDN page:
If a program attempts to access an address within a guard page, the system raises a STATUS_GUARD_PAGE_VIOLATION (
0x80000001) exception. The system also clears the PAGE_GUARD modifier, removing the memory page’s guard page status. The system will not stop the next attempt to access the memory page with a STATUS_GUARD_PAGE_VIOLATION exception.
So this guard page violation should only happen once and then get removed and never happen again. However, if we continue the execution of calc.exe, we’ll soon see another page guard violation on the same address:
This means the guard page somehow came back and is set on the KernelBase export table again.
The best guess in this case would probably be that someone registered an exception handler which gets called every time a guard page violation happens and immediately sets the PAGE_GUARD flag again, so that the same exception happens next time anything accesses the export table. Unfortunately, there is no good way to view registered exception handlers in WinDbg (unless setting the “enable exception logging” in gflags, which enables the !exrlog extension but I won’t be doing that now). However, we know that the DLL registering the suspected exception handler is most likely PayloadRestrictions.dll, so we’ll open it in IDA and take a look.
When looking for calls to RtlAddVectoredExceptionHandler, the function used to register exception handlers, we only see two results:
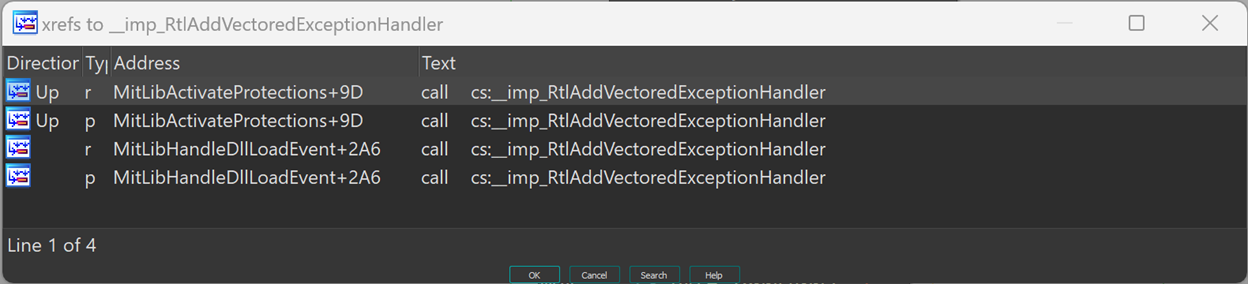
Both register the same exception handler — MitLibExceptionHandler:

(on a side note – I don’t often choose to use the IDA disassembler instead of the Hex Rays decompiler but PayloadRestrictions.dll uses some things that the decompiler doesn’t handler too well so I’ll be switching between the disassembler and decompiler code in this post)
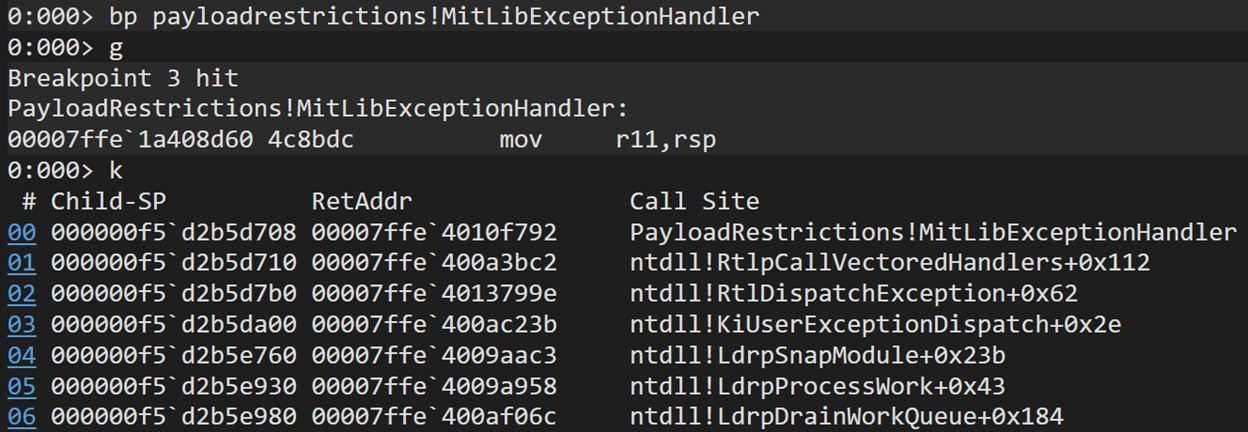
We can set a breakpoint on this exception handler and see that it gets called from the same address that threw the page guard violation exception earlier (ntdll!LdrpSnapModule+0x23b):
Looking at the exception handler itself we can see it’s quite simple:

It only handles two exception codes:
STATUS_GUARD_PAGE_VIOLATIONSTATUS_SINGLE_STEP
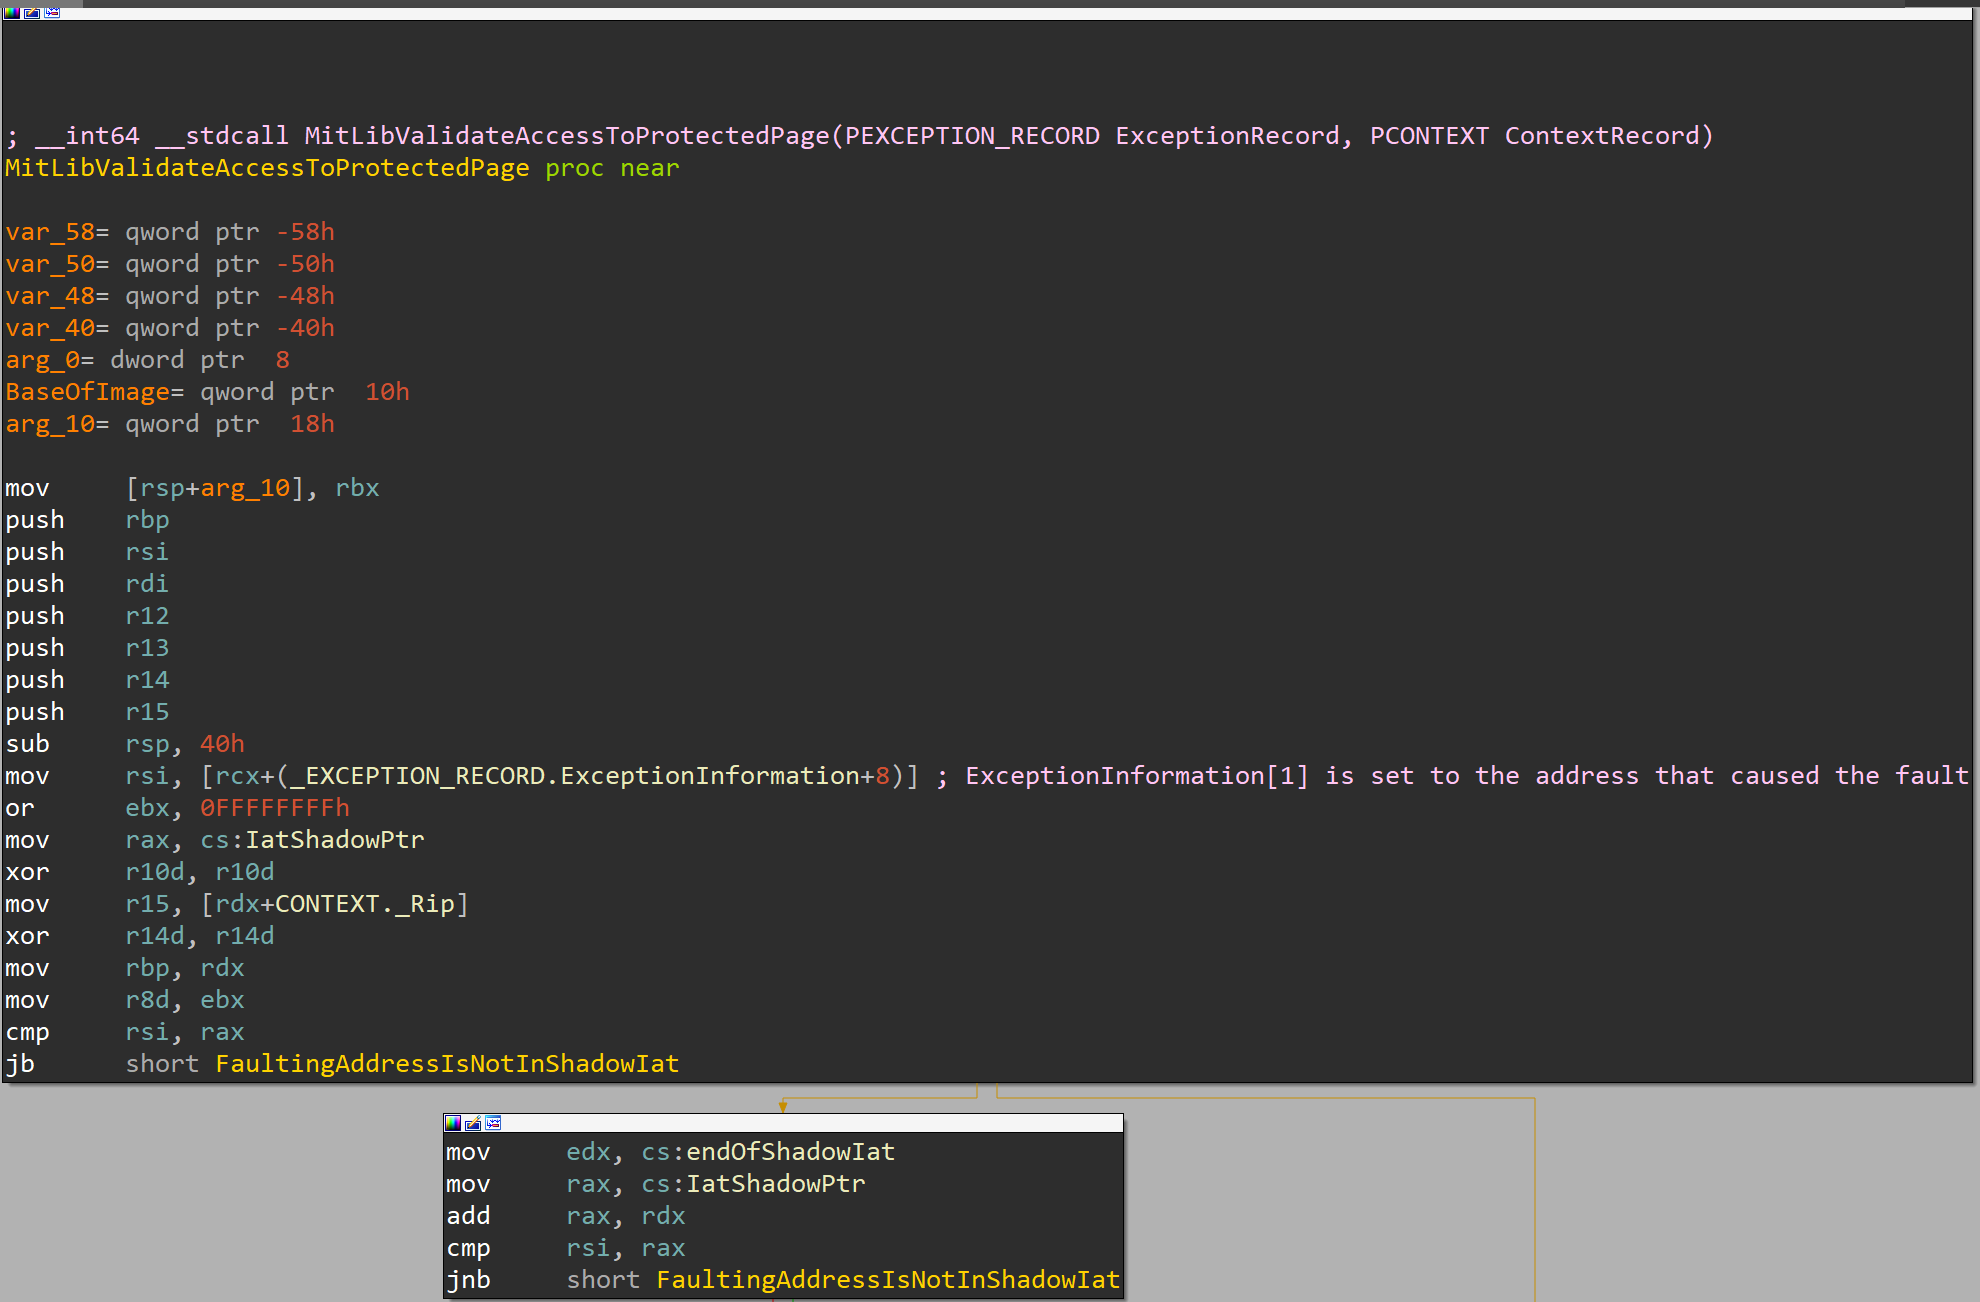
When a guard page violation happens, we can see MitLibValidateAccessToProtectedPage get called. Looking at this function, we can tell that a lot of it is dedicated to checks related to Import Address Filtering. We can guess that based on the address comparisons to the global IatShadowPtr variable and calls to various IAF functions:
Some of the code here is relevant for EAF, but for simplicity we’ll skip most of it (for now). Just by quickly scanning through this function and all the ones called by it, it doesn’t look like anything here is resetting the PAGE_GUARD modifier on the export table page.
What might give us a hint is to go back to WinDbg and continue program execution:
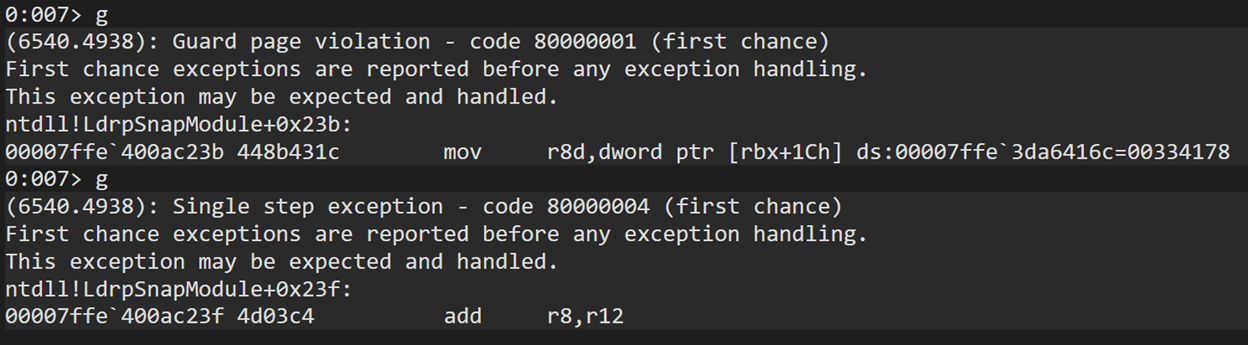
We’re immediately hitting another exception at the next instruction, this time its one of type single step exception. A single step exception is one normally triggered by debuggers when requesting a single step, such as when walking a function instruction by instruction. But in this case I asked the debugger to continue the execution, not do a single step, so it wasn’t WinDbg that triggered this exception.
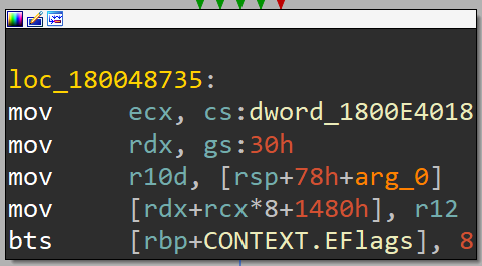
The way a single step instruction is triggered is by setting the Trap Flag (bit 8) in the EFLAGS register inside the context record. And if we look towards the end of MitLibValidateAccessToProtectedPage we can see it doing exactly that:
So far we’ve seen PayloadRestrictions.dll do the following:
- Set the
PAGE_GUARDmodifier on the export table page. - When the export table page is accessed, catch the exception with
MitLibExceptionHandlerand callMitLibValidateAccessToProtectedPageif this is a guard page violation. - Set the Trap Flag in
EFLAGSto generate a single step exception on the next instruction once execution resumes.
This matches the fact that MitLibExceptionHandler handles exactly two exception codes – guard page violations and single steps. So on the next instruction we receive the now expected single step exception and go right into MitLibHandleSingleStepException:
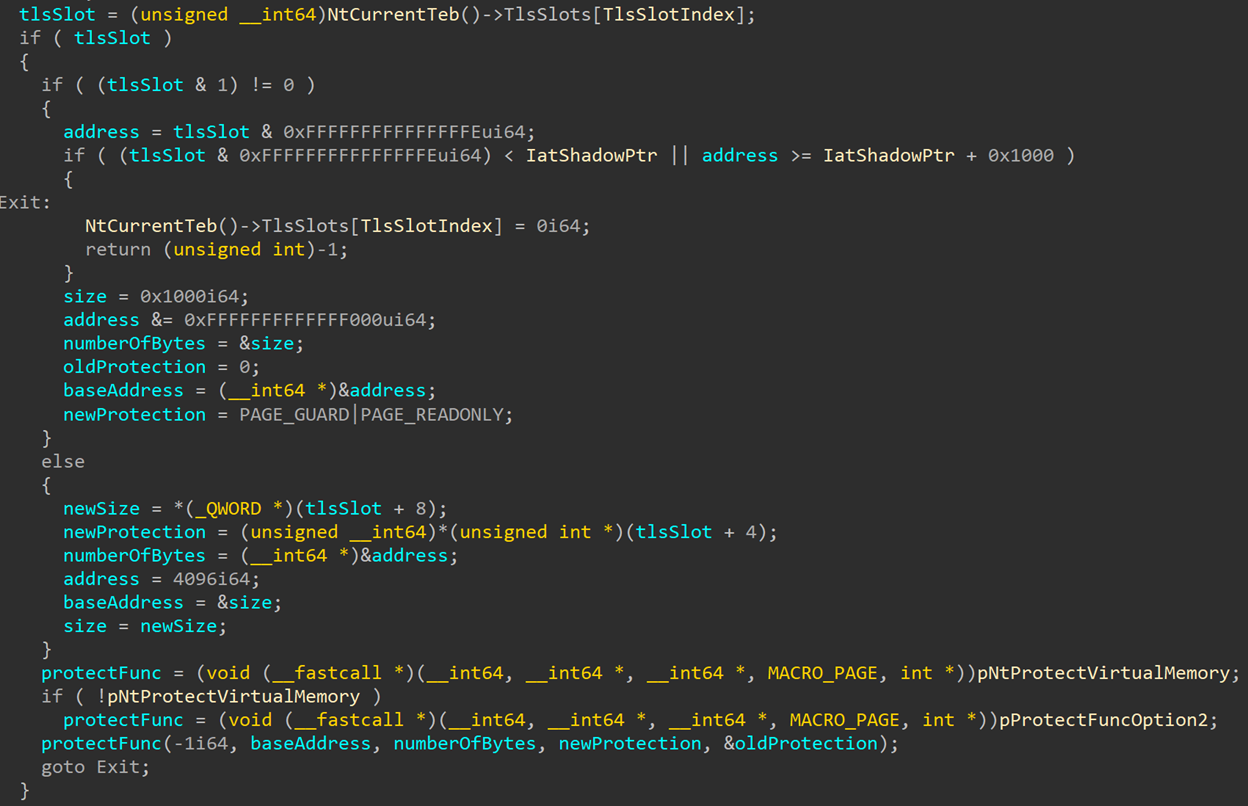
This is obviously a cleaned-up version of the original output. I saved you some of the work of checking what the global variables are and renaming them since this isn’t an especially interesting step – for example to check what function is pointed to by the variable I named pNtProtectVirtualMemory I simply dumped the pointer in WinDbg and saw it pointing to NtProtectVirtualMemory.
Back to the point – there are some things in this function that we’ll ignore for now and come back to later. What we can focus on is the call to NtProtectVirtualMemory, which (at least through one code path) sets the protection to PAGE_GUARD and PAGE_READONLY. Even without fully understanding everything we can make an educated guess and say that this is most likely the place where the KernelBase.dll export table guard page flag gets reset.
Now that we know the mechanism behind the two exceptions we’re seeing, we can go back to MitLibValidateAccessToProtectedPage to go over all the parts we skipped earlier and see what happens when a guard page violation occurs. First thing we see is a check to see if the faulting address in inside the IatShadow page. We can keep ignoring this one since it’s related to another feature (IAF) that we haven’t enabled for this process. We move on to the next section, which I titled FaultingAddressIsNotInShadowIat:
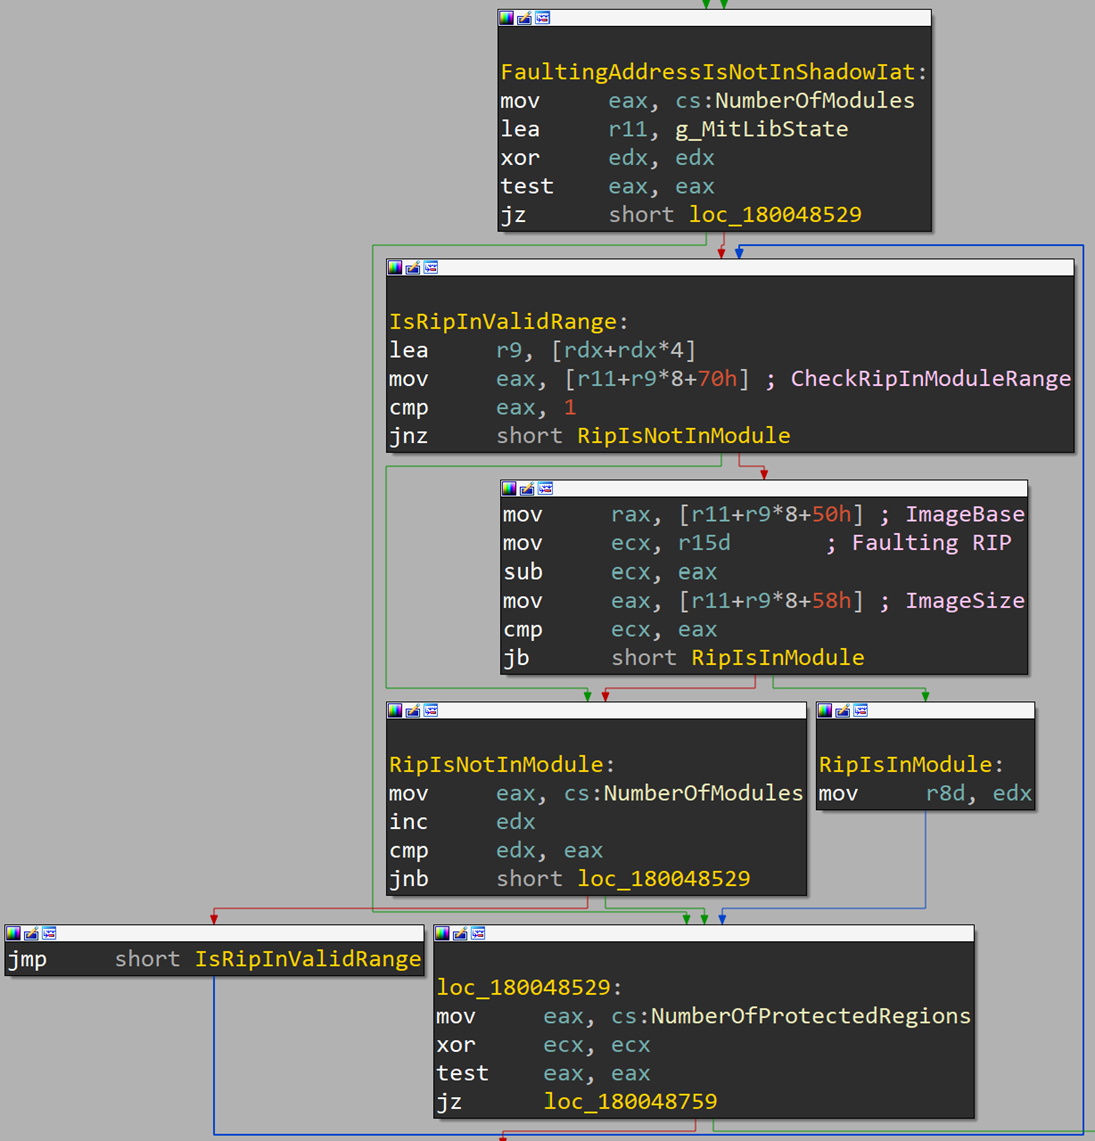
I already renamed some of the variables used here for convenience, but we’ll go over how I reached those names and titles and what this whole section does. First, we see the DLL using three global variables – g_MitLibState, a large global structure that contains all sorts of data used by PayloadRestrictions.dll, and two unnamed variables that I chose to call NumberOfModules and NumberOfProtectedRegions – we’ll soon see why I chose those names.
At a first glance, we can tell that this code is running in a loop. In each iteration it accesses some structure in g_MitLibState+0x50+index. This means there is some array at g_MitLibState+0x50, where each entry is some unknown structure. From this code, we can tell that each structure in the array in sized 0x28 bytes. Now we can either try to statically search for the function in the DLL that initializes this array and try to figure out what the structure contains, or we can go back to WinDbg and dump the already-initialized array in memory:
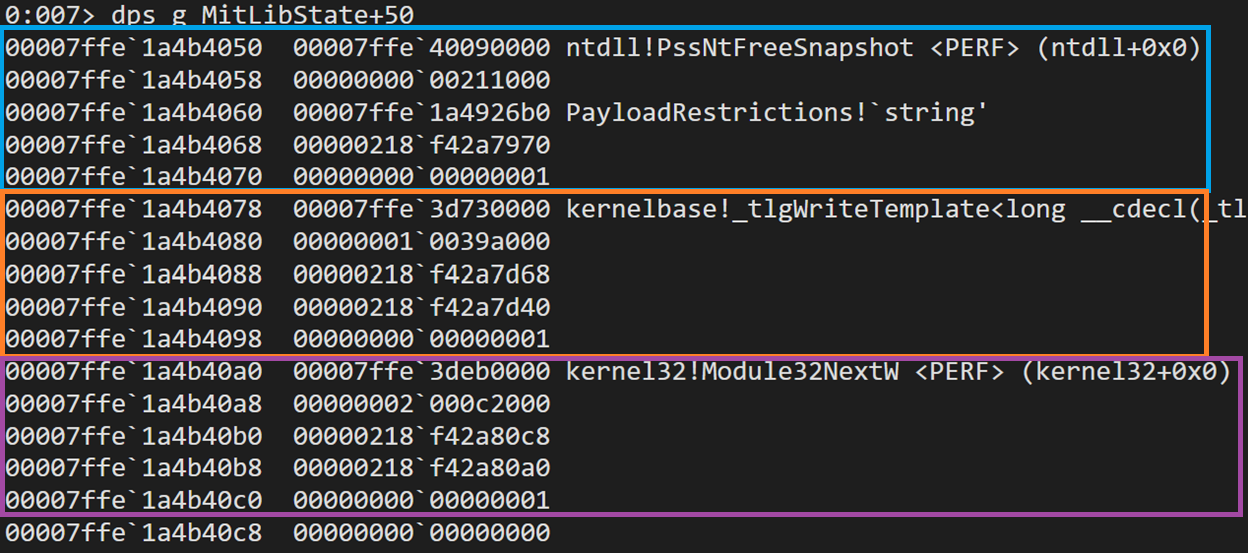
When dumping unknown memory it’s useful to use the dps command to check if there are any known symbols in the data. Looking at the array in memory we can see there are 3 entries. Using the we see that the first field in each of the structures is the base address of one module: Ntdll, KernelBase and Kernel32. Immediately following it there is a ULONG. Based on the context and the alignment we can guess that this might be the size of the DLL. A quick WinDbg query shows that this is correct:
0:007> dx @$curprocess.Modules.Where(m => m.Name.Contains("ntdll.dll")).Select(m => m.Size)
@$curprocess.Modules.Where(m => m.Name.Contains("ntdll.dll")).Select(m => m.Size)
    [0x19]           : 0x211000
0:007> dx @$curprocess.Modules.Where(m => m.Name.Contains("kernelbase.dll")).Select(m => m.Size)
@$curprocess.Modules.Where(m => m.Name.Contains("kernelbase.dll")).Select(m => m.Size)
    [0x7]            : 0x39a000
0:007> dx @$curprocess.Modules.Where(m => m.Name.Contains("kernel32.dll")).Select(m => m.Size)
@$curprocess.Modules.Where(m => m.Name.Contains("kernel32.dll")).Select(m => m.Size)
    [0xc]            : 0xc2000
Next we have a pointer to the base name of the module:
0:007> dx -r0 (wchar_t*)0x00007ffe1a4926b0
(wchar_t*)0x00007ffe1a4926b0                 : 0x7ffe1a4926b0 : "ntdll.dll" [Type: wchar_t *]
0:007> dx -r0 (wchar_t*)0x00000218f42a7d68
(wchar_t*)0x00000218f42a7d68                 : 0x218f42a7d68 : "kernelbase.dll" [Type: wchar_t *]
0:007> dx -r0 (wchar_t*)0x00000218f42a80c8
(wchar_t*)0x00000218f42a80c8                 : 0x218f42a80c8 : "kernel32.dll" [Type: wchar_t *]
And another pointer to the full path of the module:
0:007> dx -r0 (wchar_t*)0x00000218f42a7970
(wchar_t*)0x00000218f42a7970                 : 0x218f42a7970 : "C:\WINDOWS\SYSTEM32\ntdll.dll" [Type: wchar_t *]
0:007> dx -r0 (wchar_t*)0x00000218f42a7d40
(wchar_t*)0x00000218f42a7d40                 : 0x218f42a7d40 : "C:\WINDOWS\System32\kernelbase.dll" [Type: wchar_t *]
0:007> dx -r0 (wchar_t*)0x00000218f42a80a0
(wchar_t*)0x00000218f42a80a0                 : 0x218f42a80a0 : "C:\WINDOWS\System32\kernel32.dll" [Type: wchar_t *]
Finally we have a ULONG that is used in this function to indicate whether or not to check this range, so I named it CheckRipInModuleRange. When put together, we can build the following structure:
typedef struct _MODULE_INFORMATION {
PVOID ImageBase;
ULONG ImageSize;
PUCHAR ImageName;
PUCHAR FulleImagePath;
ULONG CheckRipInModuleRange;
} MODULE_INFORMATION, *PMODULE_INFORMATION;
We could define this structure in IDA and get a much nicer view of the code but I’m trying to keep this post focused on analyzing this feature so I just annotated the idb with the field names.
Now that we know what this array contains we can have a better idea of what this code does – It iterates over the structures in this array and checks if the instruction pointer that accessed the guarded page is inside one of those modules. When the loop is done – or the code found that the faulting RIP is in one of those modules – it sets r8 to the index of the module (or leaves it as -1 if a module is not found) and moves on to the next checks:

Here we have another loop, this time iterating over an array in g_MitLibState+0x5D0, where each structure is sized 0x18, and comparing it to the address that triggered the exception (in our case, the address inside the KernelBase export table). Now we already know what to do so we’ll go and dump that array in memory:
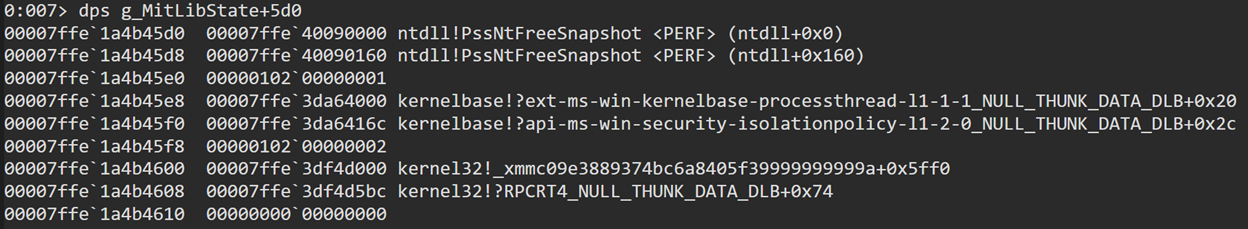
We have here three entries, each containing what looks like a start address, end address and some flag. Let’s see what each of these ranges are:
- First range starts at the base address of NTDLL and spans
0x160bytes, so pretty much covers the NTDLL headers. - Second range is one we’ve been looking at since the beginning of the post – this is the KernelBase.dll export table.
- Third range is the Kernel32.dll export table (I won’t show how we can find this out because we’ve done this for KernelBase earlier in the post).
It’s safe to assume these are the memory regions that PayloadRestrictions.dll protects and that this check is meant to check that this guard page violation was triggered for one of its protected ranges and not some other guarded page in the process.
I won’t go into as many details for the other checks in this function because that would mostly involve repeating the same steps over and over and this post is pretty long as it is. Instead we’ll look a bit further ahead at this part of the function:
This code path is called if the instruction pointer is found in one of the registered modules. Even without looking inside any of the functions that are called here we can guess that MitLibMemReaderGadgetCheck looks at the instruction that accessed the guarded page and compares them to the expected instructions, and MitLibReportAddressFilterViolation is called to report unexpected behavior if the instructions is considered “bad”.
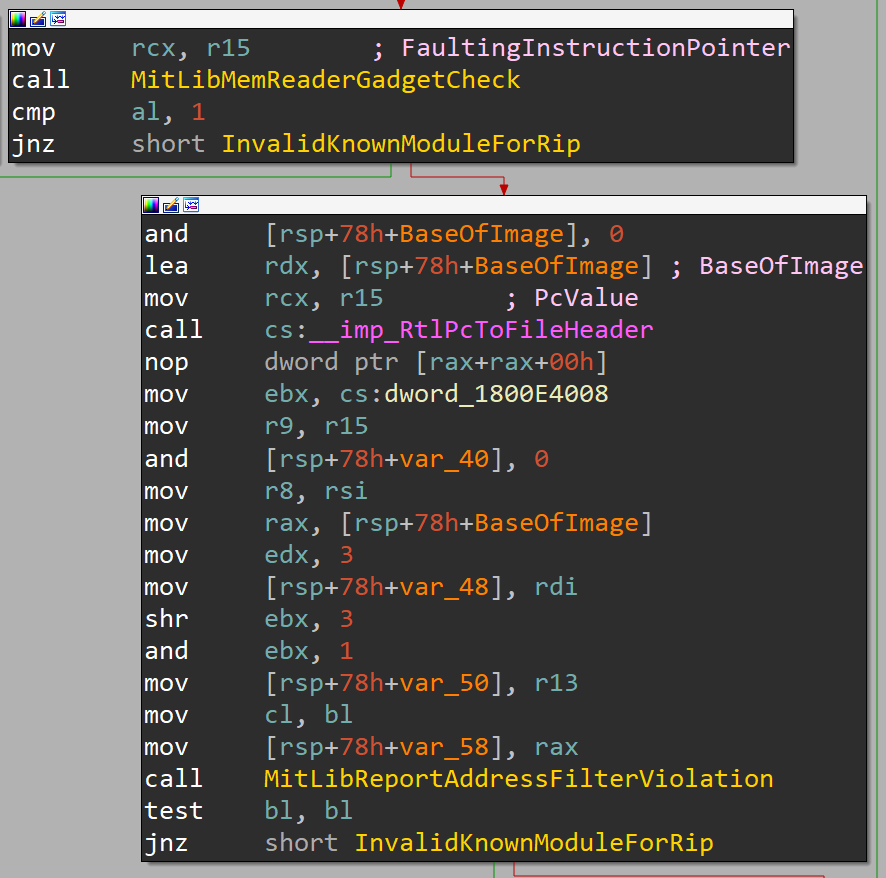
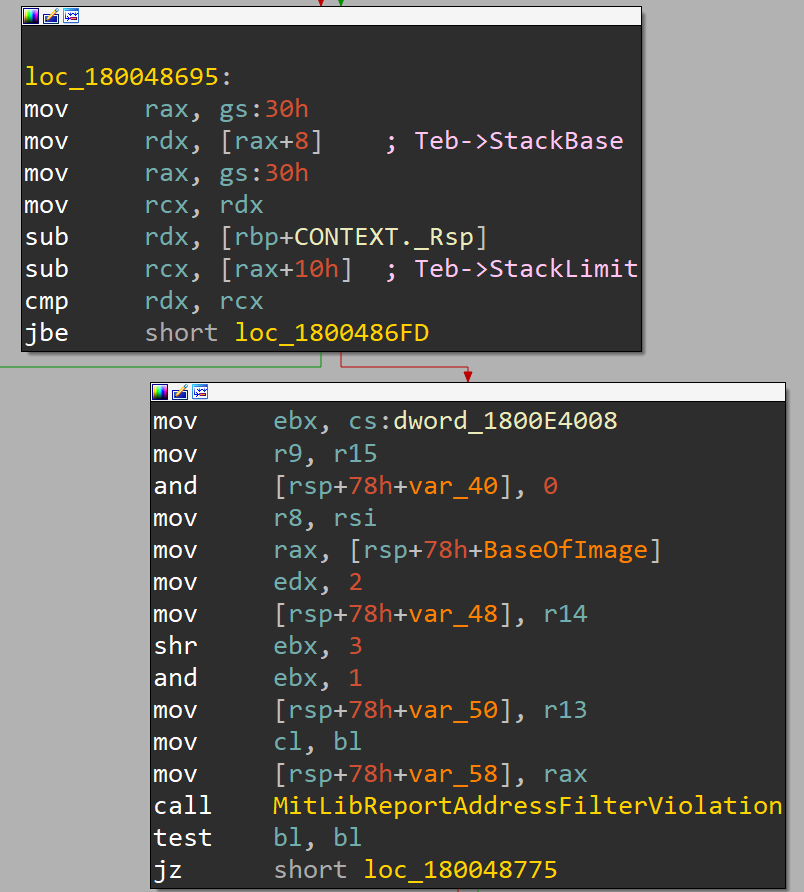
A different path is taken if the saved RIP is not in one of the known modules, which involved two final checks. The first checks if the saved RSP is inside the stack, and if it isn’t MitLibReportAddressFilterViolation is called to report potential exploitation:
The second calls RtlPcToFileHeader to get the base address of the module that the saved RIP is in and reports a violation if one is not found since that means the guarded page was accessed from within dynamic code and not an image:

All cases where MitLibReportAddressFilterViolation is called will eventually lead to a call to MitLibTriggerFailFast:
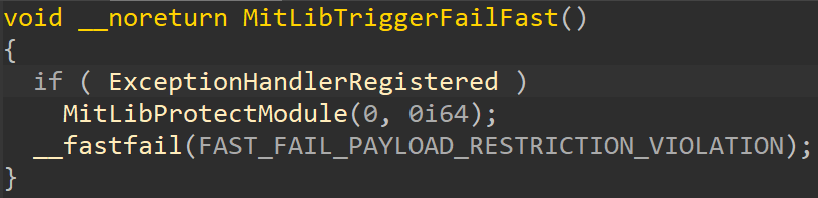
This ends up terminating the process, therefore blocking the potential exploit. If no violation is found, the function enables a single step exception for the next instruction that’ll run and the whole cycle begins again.
Of course we can keep digging into the DLL to learn about the initialization of this feature, the gadgets being searched for or what happens when a violation is reported, but I’ll leave those as assignments for someone else. For now we managed to get a good understanding of what EAF is and how it works that will allow us to further analyze it or search for potential bypasses, as well as getting some tools for analyzing similar mechanisms in PayloadRestrictions.dll or other security products.
- Random Windows Things Part 1: PreviousMode Mitigation
- Goodbye Secure Pool, Hello KDP Pool
- Secure Kernel Research with LiveCloudKd
- Troubleshooting a System Crash
- KASLR Leaks Restriction
- Investigating Filter Communication Ports
- An End to KASLR Bypasses?
- Understanding a New Mitigation: Module Tampering Protection
- One I/O Ring to Rule Them All: A Full Read/Write Exploit Primitive on Windows 11
- One Year to I/O Ring: What Changed?